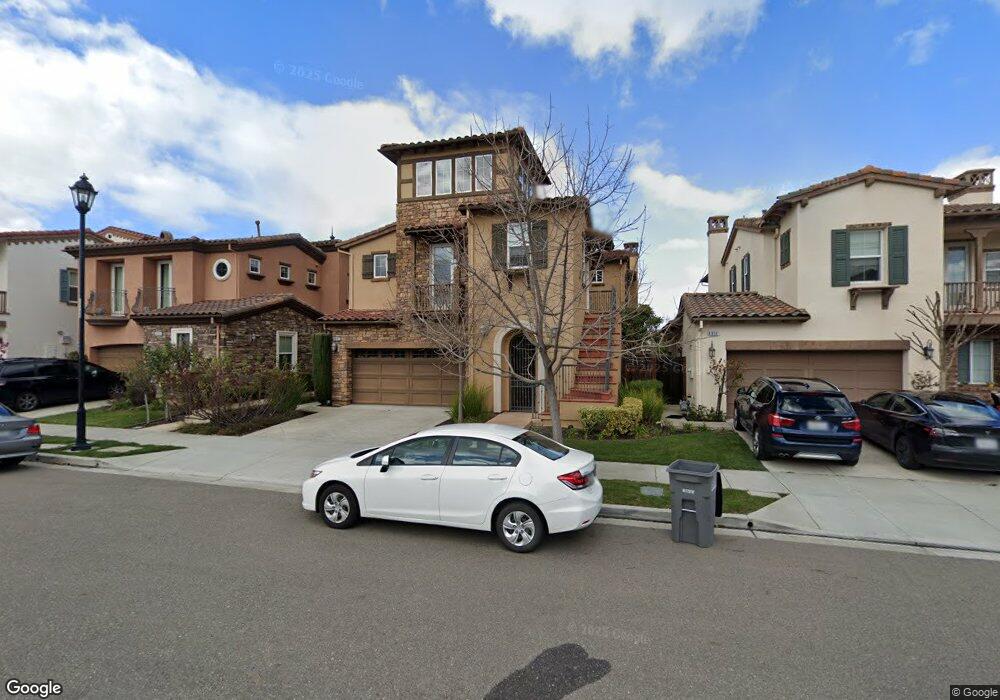
4842 Scala Ct Dublin, CA 94568
Positano NeighborhoodEstimated Value: $1,800,592 - $1,959,000
4
Beds
4
Baths
2,663
Sq Ft
$711/Sq Ft
Est. Value
About This Home
This home is located at 4842 Scala Ct, Dublin, CA 94568 and is currently estimated at $1,892,898, approximately $710 per square foot. 4842 Scala Ct is a home located in Alameda County with nearby schools including J.M. Amador Elementary School, Dublin High School, and SPRINGFIELD MONTESSORI SCHOOL.
Ownership History
Date
Name
Owned For
Owner Type
Purchase Details
Closed on
Dec 2, 2020
Sold by
Lowe Nelson T and Yang Beverly C
Bought by
Lowe Nelson T and Yang Beverly C
Current Estimated Value
Home Financials for this Owner
Home Financials are based on the most recent Mortgage that was taken out on this home.
Original Mortgage
$640,000
Outstanding Balance
$465,549
Interest Rate
2.8%
Mortgage Type
New Conventional
Estimated Equity
$1,427,349
Purchase Details
Closed on
Nov 27, 2019
Sold by
Lowe Nelson T and Yang Beverly C
Bought by
Lowe Nelson T and Yang Beverly C
Purchase Details
Closed on
Aug 4, 2016
Sold by
Gray Borghild Johanna and Borghild Johanna Gray Trust
Bought by
Lowe Nelson Terrance and Yang Beverly Crystal
Home Financials for this Owner
Home Financials are based on the most recent Mortgage that was taken out on this home.
Original Mortgage
$702,000
Interest Rate
3.41%
Mortgage Type
New Conventional
Purchase Details
Closed on
Sep 3, 2009
Sold by
Braddock & Logan Group Ii Lp
Bought by
Gray Borghild Johanna and Borghild Johanna Gray Trust
Create a Home Valuation Report for This Property
The Home Valuation Report is an in-depth analysis detailing your home's value as well as a comparison with similar homes in the area
Home Values in the Area
Average Home Value in this Area
Purchase History
| Date | Buyer | Sale Price | Title Company |
|---|---|---|---|
| Lowe Nelson T | -- | Accommodation | |
| Lowe Nelson T | -- | Wfg National Title Ins Co | |
| Lowe Nelson T | -- | None Available | |
| Lowe Nelson Terrance | $1,090,000 | Chicago Title Company | |
| Gray Borghild Johanna | -- | First American Title |
Source: Public Records
Mortgage History
| Date | Status | Borrower | Loan Amount |
|---|---|---|---|
| Open | Lowe Nelson T | $640,000 | |
| Closed | Lowe Nelson Terrance | $702,000 |
Source: Public Records
Tax History
| Year | Tax Paid | Tax Assessment Tax Assessment Total Assessment is a certain percentage of the fair market value that is determined by local assessors to be the total taxable value of land and additions on the property. | Land | Improvement |
|---|---|---|---|---|
| 2025 | $16,912 | $1,258,010 | $379,503 | $885,507 |
| 2024 | $16,912 | $1,233,212 | $372,063 | $868,149 |
| 2023 | $17,198 | $1,215,894 | $364,768 | $851,126 |
| 2022 | $16,979 | $1,185,056 | $357,617 | $834,439 |
| 2021 | $16,792 | $1,161,686 | $350,606 | $818,080 |
| 2020 | $15,739 | $1,156,707 | $347,012 | $809,695 |
| 2019 | $15,741 | $1,134,035 | $340,210 | $793,825 |
| 2018 | $15,371 | $1,111,800 | $333,540 | $778,260 |
| 2017 | $15,155 | $1,090,000 | $327,000 | $763,000 |
| 2016 | $2,368 | $84,072 | $34,913 | $49,159 |
| 2015 | $2,305 | $82,810 | $34,389 | $48,421 |
| 2014 | $2,271 | $81,189 | $33,716 | $47,473 |
Source: Public Records
Map
Nearby Homes
- 4999 Piper Glen Terrace
- 4899 Landmark Way
- 5271 Salerno Dr
- 4450 Sunset View Dr
- 2890 Sable Oaks Way
- 1937 Whitney Ave
- 4166 Forest Springs Rd
- 1935 Ingalls Way
- 2539 Brandini Dr
- 3063 Ridgefield Ct
- 1691 S Wren St
- 5653 Signal Hill Dr
- 1949 Michael Ave
- 2206 Central Pkwy
- 1913 Michael Ave
- 1901 Michael Ave
- 4309 Langley Rd
- 1799 Sill Ave
- 3986 Pino Grande Rd
- 2848 E Cog Hill Terrace
- 4836 Scala Ct
- 4850 Scala Ct
- 4830 Scala Ct
- 4849 Scala Ct
- 2393 W Cantara Dr
- 4855 Scala Ct
- 4843 Scala Ct
- 2387 W Cantara Dr
- 2381 W Cantara Dr
- 4835 Scala Ct
- 2373 W Cantara Dr
- 4832 La Vina St
- 2367 W Cantara Dr
- 2359 W Cantara Dr
- 4826 La Vina St
- 4820 La Vina St
- 2423 Capistrello St
- 2408 Amatrice Way
- 2400 Amatrice Way
- 2353 W Cantara Dr
Your Personal Tour Guide
Ask me questions while you tour the home.