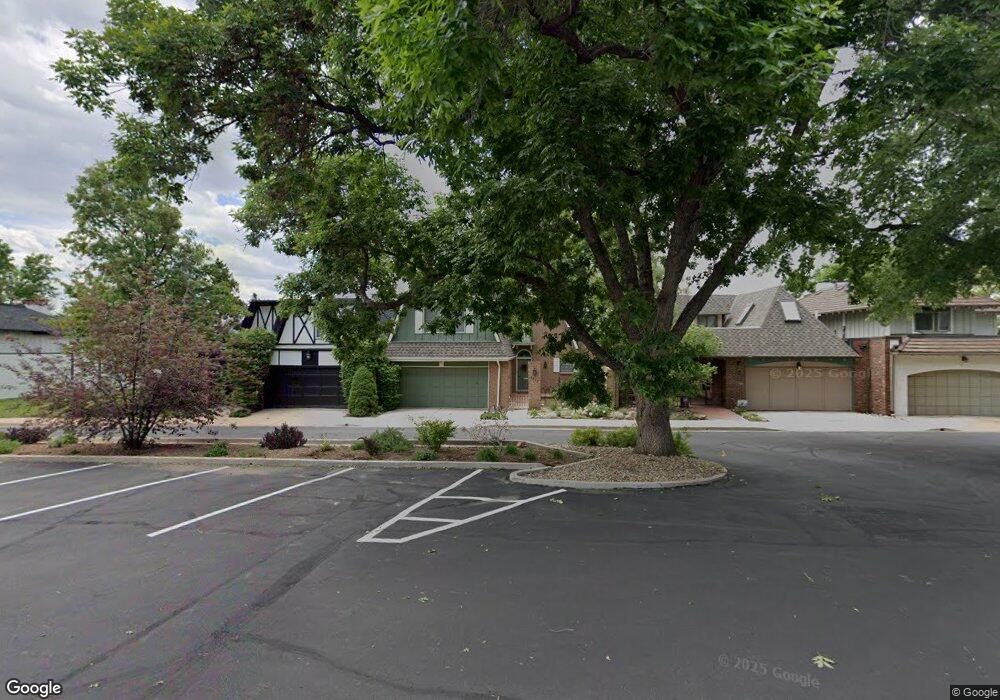
4843 Briar Ridge Ct Boulder, CO 80301
Gunbarrel NeighborhoodEstimated Value: $752,819 - $933,000
2
Beds
3
Baths
2,857
Sq Ft
$297/Sq Ft
Est. Value
About This Home
This home is located at 4843 Briar Ridge Ct, Boulder, CO 80301 and is currently estimated at $848,205, approximately $296 per square foot. 4843 Briar Ridge Ct is a home located in Boulder County with nearby schools including Heatherwood Elementary School, Nevin Platt Middle School, and Boulder High School.
Ownership History
Date
Name
Owned For
Owner Type
Purchase Details
Closed on
Oct 25, 2021
Sold by
Morgan Robert J and Morgan Susan M
Bought by
Collins John C and Collins Laura A
Current Estimated Value
Home Financials for this Owner
Home Financials are based on the most recent Mortgage that was taken out on this home.
Original Mortgage
$399,000
Outstanding Balance
$364,380
Interest Rate
2.75%
Mortgage Type
New Conventional
Estimated Equity
$483,825
Purchase Details
Closed on
Jun 19, 1998
Sold by
Morgan Robert J and Morgan Susan M
Bought by
Morgan Robert J
Purchase Details
Closed on
Jan 25, 1996
Sold by
Holsten William G and Holsten Phyllis M
Bought by
Morgan Robert J
Home Financials for this Owner
Home Financials are based on the most recent Mortgage that was taken out on this home.
Original Mortgage
$243,000
Interest Rate
5.5%
Purchase Details
Closed on
Jan 28, 1992
Bought by
Morgan Living Trust
Purchase Details
Closed on
Nov 25, 1986
Bought by
Morgan Living Trust
Create a Home Valuation Report for This Property
The Home Valuation Report is an in-depth analysis detailing your home's value as well as a comparison with similar homes in the area
Home Values in the Area
Average Home Value in this Area
Purchase History
| Date | Buyer | Sale Price | Title Company |
|---|---|---|---|
| Collins John C | $699,000 | Land Title Guarantee | |
| Morgan Robert J | -- | -- | |
| Morgan Robert J | $270,000 | Commonwealth Land Title | |
| Morgan Living Trust | $185,000 | -- | |
| Morgan Living Trust | -- | -- |
Source: Public Records
Mortgage History
| Date | Status | Borrower | Loan Amount |
|---|---|---|---|
| Open | Collins John C | $399,000 | |
| Previous Owner | Morgan Robert J | $243,000 |
Source: Public Records
Tax History Compared to Growth
Tax History
| Year | Tax Paid | Tax Assessment Tax Assessment Total Assessment is a certain percentage of the fair market value that is determined by local assessors to be the total taxable value of land and additions on the property. | Land | Improvement |
|---|---|---|---|---|
| 2025 | $4,353 | $54,925 | $23,469 | $31,456 |
| 2024 | $4,353 | $54,925 | $23,469 | $31,456 |
| 2023 | $4,282 | $46,967 | $25,259 | $25,393 |
| 2022 | $4,671 | $47,837 | $18,577 | $29,260 |
| 2021 | $3,812 | $49,214 | $19,112 | $30,102 |
| 2020 | $3,537 | $45,731 | $16,445 | $29,286 |
| 2019 | $3,482 | $45,731 | $16,445 | $29,286 |
| 2018 | $3,363 | $44,042 | $14,040 | $30,002 |
| 2017 | $3,263 | $48,691 | $15,522 | $33,169 |
| 2016 | $2,474 | $35,008 | $12,736 | $22,272 |
| 2015 | $2,350 | $32,572 | $17,910 | $14,662 |
| 2014 | $2,219 | $32,572 | $17,910 | $14,662 |
Source: Public Records
Map
Nearby Homes
- 4803 Briar Ridge Ct
- 4953 Clubhouse Ct
- 4936 Clubhouse Cir
- 7302 Island Cir
- 4993 Clubhouse Ct
- 7430 Clubhouse Rd
- 4697 Tanglewood Trail
- 7264 Siena Way Unit C
- 5128 Buckingham Rd
- 5174 Buckingham Rd Unit L1
- 7126 Cedarwood Cir
- 4667 Ashfield Dr
- 7329 Windsor Dr
- 7028 Indian Peaks Trail
- 7134 Cedarwood Cir
- 7481 Singing Hills Dr
- 7434 Singing Hills Ct Unit J7434
- 7443 Singing Hills Ct
- 4862 Silver Sage Ct
- 7400 Singing Hills Dr Unit K7400
- 4833 Briar Ridge Ct
- 4853 Briar Ridge Ct
- 4823 Briar Ridge Ct
- 4863 Briar Ridge Ct
- 4873 Briar Ridge Ct
- 4883 Briar Ridge Ct
- 4813 Briar Ridge Ct
- 4893 Briar Ridge Ct
- 4824 Briar Ridge Ct
- 4820 Briar Ridge Ct
- 4854 Briar Ridge Ct
- 4807 Briar Ridge Ct
- 4864 Briar Ridge Ct
- 4818 Briar Ridge Ct
- 4874 Briar Ridge Ct
- 4814 Briar Ridge Ct
- 4884 Briar Ridge Ct
- 4808 Briar Ridge Ct
- 4894 Briar Ridge Ct
- 4902 Clubhouse Ct