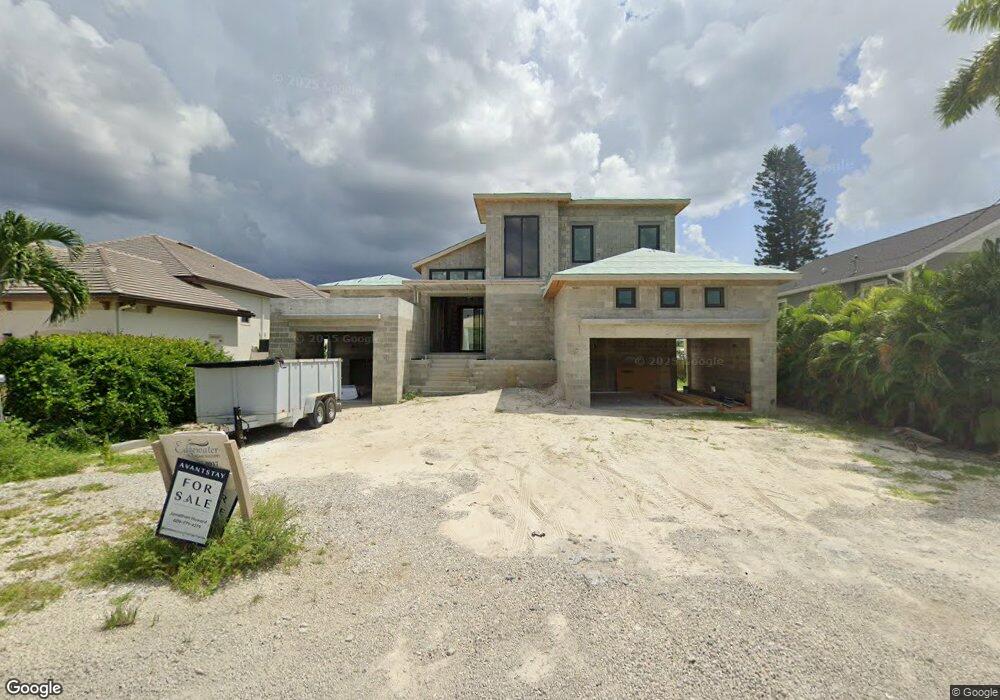
4847 Esplanade St Unit B Bonita Springs, FL 34134
Imperial Shores NeighborhoodEstimated Value: $538,431 - $1,460,000
2
Beds
2
Baths
900
Sq Ft
$928/Sq Ft
Est. Value
About This Home
This home is located at 4847 Esplanade St Unit B, Bonita Springs, FL 34134 and is currently estimated at $835,108, approximately $927 per square foot. 4847 Esplanade St Unit B is a home located in Lee County with nearby schools including Bonita Springs Elementary School, Spring Creek Elementary School, and Pinewoods Elementary School.
Ownership History
Date
Name
Owned For
Owner Type
Purchase Details
Closed on
Nov 30, 2022
Sold by
Dellatore Scott A and Dellatore Angela Lutzi
Bought by
Tarpon Avenue 2 Llc
Current Estimated Value
Purchase Details
Closed on
Jul 19, 2019
Sold by
Okerstrom Michael J and Okerstrom Tina M
Bought by
Dellatore Scott A and Lutzi Angela J
Home Financials for this Owner
Home Financials are based on the most recent Mortgage that was taken out on this home.
Original Mortgage
$330,000
Interest Rate
3.82%
Mortgage Type
New Conventional
Purchase Details
Closed on
Oct 16, 2015
Sold by
Bish Troy
Bought by
Tenac Michael J and Okerstrom Joint Tenac M T
Purchase Details
Closed on
Jul 8, 2009
Sold by
Boschian Rosemary
Bought by
Bish Troy
Purchase Details
Closed on
Nov 4, 2008
Sold by
Franchini Robert J
Bought by
Boschian Rosemary
Purchase Details
Closed on
Nov 30, 2000
Sold by
Meakim Eileen L
Bought by
Franchini Joseph and Franchini Joseph V
Create a Home Valuation Report for This Property
The Home Valuation Report is an in-depth analysis detailing your home's value as well as a comparison with similar homes in the area
Home Values in the Area
Average Home Value in this Area
Purchase History
| Date | Buyer | Sale Price | Title Company |
|---|---|---|---|
| Tarpon Avenue 2 Llc | $630,000 | None Listed On Document | |
| Dellatore Scott A | $440,000 | Attorney | |
| Tenac Michael J | $427,500 | Classic Title Services Inc | |
| Bish Troy | $322,000 | Classic Title Services Inc | |
| Boschian Rosemary | $260,000 | Attorney | |
| Franchini Joseph | -- | -- |
Source: Public Records
Mortgage History
| Date | Status | Borrower | Loan Amount |
|---|---|---|---|
| Previous Owner | Dellatore Scott A | $330,000 |
Source: Public Records
Tax History Compared to Growth
Tax History
| Year | Tax Paid | Tax Assessment Tax Assessment Total Assessment is a certain percentage of the fair market value that is determined by local assessors to be the total taxable value of land and additions on the property. | Land | Improvement |
|---|---|---|---|---|
| 2025 | $8,353 | $609,323 | $585,034 | -- |
| 2024 | $8,353 | $604,865 | -- | -- |
| 2023 | $7,747 | $549,877 | $549,867 | $10 |
| 2022 | $6,031 | $370,944 | $0 | $0 |
| 2021 | $4,866 | $317,588 | $303,180 | $14,408 |
| 2020 | $4,723 | $298,767 | $282,968 | $15,799 |
| 2019 | $4,592 | $288,276 | $202,120 | $86,156 |
| 2018 | $4,579 | $282,625 | $202,120 | $80,505 |
| 2017 | $4,490 | $269,707 | $200,738 | $68,969 |
| 2016 | $4,248 | $250,019 | $150,612 | $99,407 |
| 2015 | $3,484 | $202,509 | $165,000 | $37,509 |
| 2014 | $3,738 | $256,871 | $200,738 | $56,133 |
| 2013 | -- | $212,135 | $200,738 | $11,397 |
Source: Public Records
Map
Nearby Homes
- 4851 Esplanade St
- 4843 Esplanade St
- 4897 Esplanade St
- 4855 Esplanade St
- 4839 Esplanade St
- 4854 Esplanade St Unit 1
- 4850 Esplanade St
- 4848 Esplanade St
- 4860/4862 Esplanade St
- 4859/4861 Esplanade St
- 4846 Regal Dr
- 4850 Regal Dr
- 4842 Esplanade St
- 4844 Esplanade St
- 4854 Regal Dr
- 4859 Esplanade St
- 4838 Regal Dr
- 4838 Esplanade St
- 4835 Esplanade St
- 4863 Esplanade St