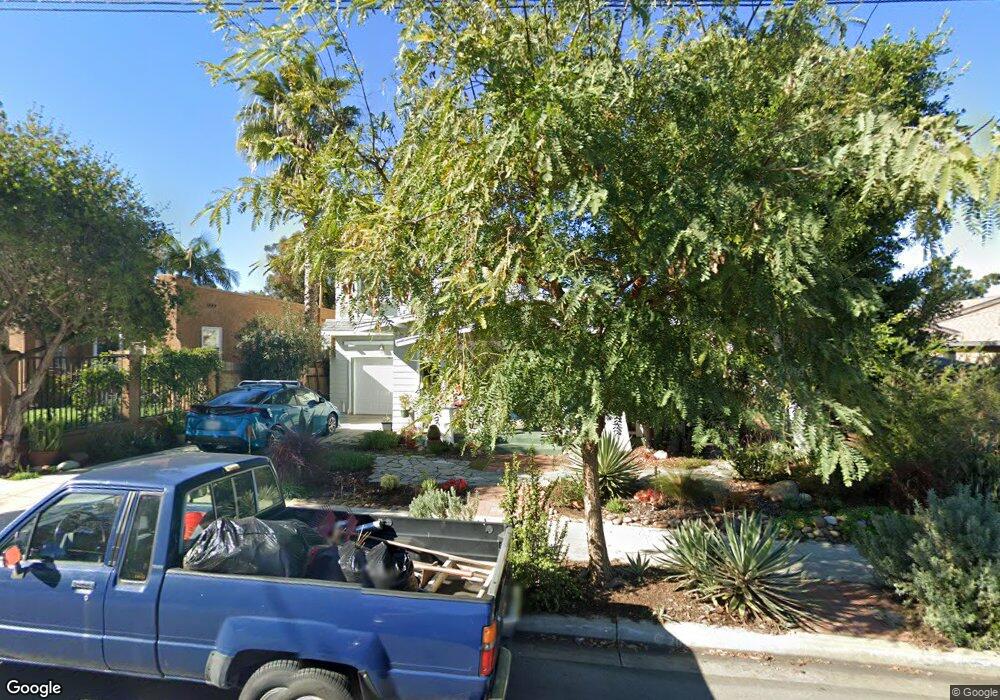
4848 39th St San Diego, CA 92116
Normal Heights NeighborhoodEstimated Value: $1,573,000 - $2,168,000
3
Beds
4
Baths
2,372
Sq Ft
$738/Sq Ft
Est. Value
About This Home
This home is located at 4848 39th St, San Diego, CA 92116 and is currently estimated at $1,749,492, approximately $737 per square foot. 4848 39th St is a home located in San Diego County with nearby schools including Normal Heights Elementary, Wilson Middle School, and Herbert Hoover High School.
Ownership History
Date
Name
Owned For
Owner Type
Purchase Details
Closed on
Aug 13, 2021
Sold by
Coleman Lawrence S and Jensen Jeannine A
Bought by
Coleman Lawrence and Jensen Jeannine
Current Estimated Value
Home Financials for this Owner
Home Financials are based on the most recent Mortgage that was taken out on this home.
Original Mortgage
$327,398
Outstanding Balance
$275,020
Interest Rate
2.9%
Mortgage Type
New Conventional
Estimated Equity
$1,474,472
Purchase Details
Closed on
Sep 25, 2017
Sold by
Coleman Lawrence and Jensen Jeannine
Bought by
Coleman Lawrence and Jensen Jeannine
Purchase Details
Closed on
Oct 27, 1988
Bought by
Coleman Lawrence Jensen Jeannine
Purchase Details
Closed on
Apr 18, 1986
Create a Home Valuation Report for This Property
The Home Valuation Report is an in-depth analysis detailing your home's value as well as a comparison with similar homes in the area
Home Values in the Area
Average Home Value in this Area
Purchase History
| Date | Buyer | Sale Price | Title Company |
|---|---|---|---|
| Coleman Lawrence | -- | First American Title Ins Co | |
| Coleman Lawrence S | -- | First American Title Company | |
| Coleman Lawrence | -- | None Available | |
| Coleman Lawrence Jensen Jeannine | $177,000 | -- | |
| -- | $118,500 | -- |
Source: Public Records
Mortgage History
| Date | Status | Borrower | Loan Amount |
|---|---|---|---|
| Open | Coleman Lawrence S | $327,398 |
Source: Public Records
Tax History Compared to Growth
Tax History
| Year | Tax Paid | Tax Assessment Tax Assessment Total Assessment is a certain percentage of the fair market value that is determined by local assessors to be the total taxable value of land and additions on the property. | Land | Improvement |
|---|---|---|---|---|
| 2025 | $6,964 | $582,650 | $187,640 | $395,010 |
| 2024 | $6,964 | $571,226 | $183,961 | $387,265 |
| 2023 | $6,809 | $560,026 | $180,354 | $379,672 |
| 2022 | $6,626 | $549,046 | $176,818 | $372,228 |
| 2021 | $6,579 | $538,281 | $173,351 | $364,930 |
| 2020 | $6,341 | $519,896 | $171,574 | $348,322 |
| 2019 | $6,226 | $509,703 | $168,210 | $341,493 |
| 2018 | $5,820 | $499,710 | $164,912 | $334,798 |
| 2017 | $5,680 | $489,913 | $161,679 | $328,234 |
| 2016 | $5,588 | $480,308 | $158,509 | $321,799 |
| 2015 | $5,504 | $473,095 | $156,129 | $316,966 |
| 2014 | $5,416 | $463,829 | $153,071 | $310,758 |
Source: Public Records
Map
Nearby Homes
- 3621 Collier Ave
- 4860 Marlborough Dr
- 4671-73 Terrace Dr
- 4033 S Hempstead Cir
- 4609 E Mountain View Dr
- 5027 E Mountain View Dr
- 3554-56 Sydney Place
- 4153 1/2 Adams Ave
- 4153 Adams Ave
- 4010 S Hempstead Cir
- 4542 Cherokee Ave
- 5075-77 35th St
- 4511 37th St Unit 5
- 4192 Rochester Rd
- 3535 Madison Ave
- 4842 Hawley Blvd
- 4554 Marlborough Dr Unit 2
- 4603 35th St
- 3909 Monroe Ave Unit 101
- 4510 Marlborough Dr