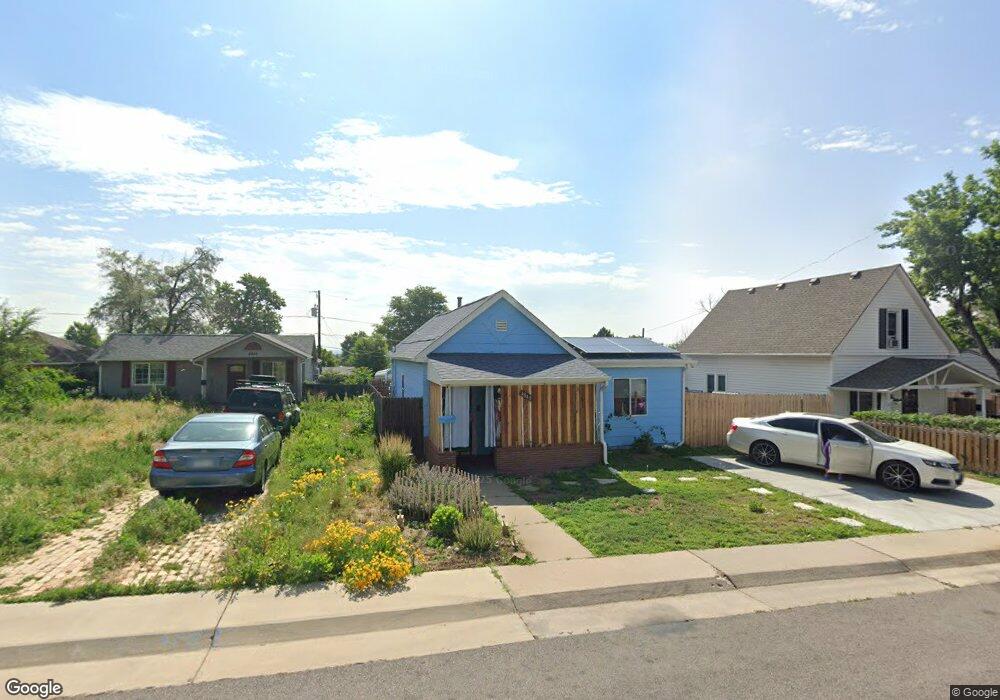
4848 Bryant St Denver, CO 80221
Chaffee Park NeighborhoodEstimated Value: $421,743 - $462,000
2
Beds
2
Baths
905
Sq Ft
$491/Sq Ft
Est. Value
About This Home
This home is located at 4848 Bryant St, Denver, CO 80221 and is currently estimated at $443,936, approximately $490 per square foot. 4848 Bryant St is a home located in Denver County with nearby schools including Beach Court Elementary School, Bryant Webster Dual Language School, and Denver Montessori Junior/Senior High School.
Ownership History
Date
Name
Owned For
Owner Type
Purchase Details
Closed on
Apr 24, 1998
Sold by
Preston Preston O and Preston Barbara R
Bought by
Garcia Emma C
Current Estimated Value
Home Financials for this Owner
Home Financials are based on the most recent Mortgage that was taken out on this home.
Original Mortgage
$79,400
Outstanding Balance
$13,719
Interest Rate
7.09%
Mortgage Type
FHA
Estimated Equity
$430,217
Create a Home Valuation Report for This Property
The Home Valuation Report is an in-depth analysis detailing your home's value as well as a comparison with similar homes in the area
Home Values in the Area
Average Home Value in this Area
Purchase History
| Date | Buyer | Sale Price | Title Company |
|---|---|---|---|
| Garcia Emma C | $80,000 | Colorado National Title |
Source: Public Records
Mortgage History
| Date | Status | Borrower | Loan Amount |
|---|---|---|---|
| Open | Garcia Emma C | $79,400 |
Source: Public Records
Tax History
| Year | Tax Paid | Tax Assessment Tax Assessment Total Assessment is a certain percentage of the fair market value that is determined by local assessors to be the total taxable value of land and additions on the property. | Land | Improvement |
|---|---|---|---|---|
| 2025 | $1,941 | $32,510 | $18,460 | $18,460 |
| 2024 | $1,941 | $24,510 | $13,860 | $10,650 |
| 2023 | $1,899 | $24,510 | $13,860 | $10,650 |
| 2022 | $1,845 | $23,200 | $13,650 | $9,550 |
| 2021 | $1,780 | $23,860 | $14,040 | $9,820 |
| 2020 | $1,558 | $21,000 | $14,040 | $6,960 |
| 2019 | $1,514 | $21,000 | $14,040 | $6,960 |
| 2018 | $993 | $12,840 | $7,070 | $5,770 |
| 2017 | $990 | $12,840 | $7,070 | $5,770 |
| 2016 | $787 | $9,650 | $3,128 | $6,522 |
| 2015 | $754 | $9,650 | $3,128 | $6,522 |
| 2014 | $562 | $6,770 | $3,240 | $3,530 |
Source: Public Records
Map
Nearby Homes
- 4901 Bryant St
- 4822 Bryant St
- 4927 Beach Ct
- 4829 Alcott St
- 4876 Decatur St
- 4775 Decatur St
- 5051 Zuni St
- 4647 Bryant St
- 4742 Eliot St
- 4721 Elm Ct
- 4736 Wyandot St
- 4600 N Clay St
- 4635 Elm Ct
- 3011 W 49th Ave
- 4956 Umatilla St
- 4994 Umatilla St
- 2315 W 46th Ave
- 3047 W 47th Ave Unit 105
- 3047 W 47th Ave Unit 511
- 3047 W 47th Ave Unit 602
Your Personal Tour Guide
Ask me questions while you tour the home.