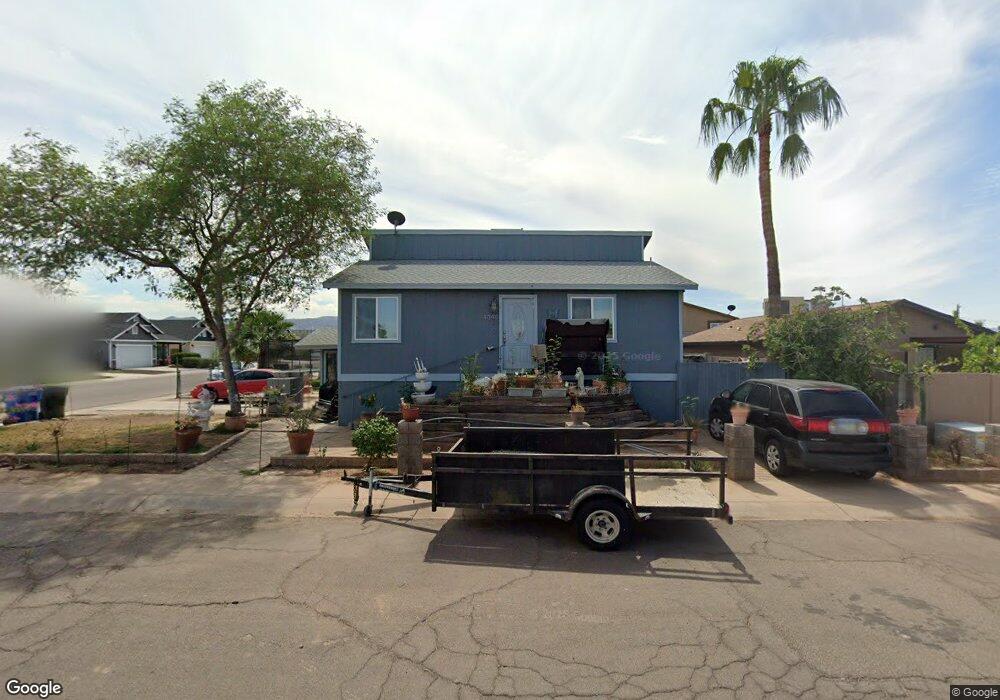
4848 S 11th St Phoenix, AZ 85040
South Mountain NeighborhoodEstimated Value: $279,000 - $315,000
--
Bed
1
Bath
1,200
Sq Ft
$243/Sq Ft
Est. Value
About This Home
This home is located at 4848 S 11th St, Phoenix, AZ 85040 and is currently estimated at $291,529, approximately $242 per square foot. 4848 S 11th St is a home located in Maricopa County with nearby schools including Irene Lopez School, South Mountain High School, and Phoenix Coding Academy.
Ownership History
Date
Name
Owned For
Owner Type
Purchase Details
Closed on
Apr 15, 2021
Sold by
Chaparro David Jesus
Bought by
Garibay Jesse
Current Estimated Value
Home Financials for this Owner
Home Financials are based on the most recent Mortgage that was taken out on this home.
Original Mortgage
$172,568
Outstanding Balance
$156,057
Interest Rate
3.1%
Mortgage Type
FHA
Estimated Equity
$135,472
Purchase Details
Closed on
Feb 13, 2006
Sold by
Garibay Yolanda
Bought by
Chaparro David Jesus
Home Financials for this Owner
Home Financials are based on the most recent Mortgage that was taken out on this home.
Original Mortgage
$25,100
Interest Rate
6.15%
Mortgage Type
Stand Alone Second
Create a Home Valuation Report for This Property
The Home Valuation Report is an in-depth analysis detailing your home's value as well as a comparison with similar homes in the area
Home Values in the Area
Average Home Value in this Area
Purchase History
| Date | Buyer | Sale Price | Title Company |
|---|---|---|---|
| Garibay Jesse | $212,000 | Security Title Agency | |
| Chaparro David Jesus | $120,000 | Security Title Agency Inc | |
| Garibay Yolanda | -- | Security Title Agency Inc |
Source: Public Records
Mortgage History
| Date | Status | Borrower | Loan Amount |
|---|---|---|---|
| Open | Garibay Jesse | $172,568 | |
| Previous Owner | Garibay Yolanda | $25,100 | |
| Previous Owner | Chaparro David Jesus | $94,900 |
Source: Public Records
Tax History
| Year | Tax Paid | Tax Assessment Tax Assessment Total Assessment is a certain percentage of the fair market value that is determined by local assessors to be the total taxable value of land and additions on the property. | Land | Improvement |
|---|---|---|---|---|
| 2025 | $855 | $6,327 | -- | -- |
| 2024 | $808 | $6,026 | -- | -- |
| 2023 | $808 | $17,910 | $3,580 | $14,330 |
| 2022 | $791 | $13,170 | $2,630 | $10,540 |
| 2021 | $816 | $10,680 | $2,130 | $8,550 |
| 2020 | $892 | $10,620 | $2,120 | $8,500 |
| 2019 | $863 | $7,900 | $1,580 | $6,320 |
| 2018 | $840 | $7,400 | $1,480 | $5,920 |
| 2017 | $800 | $5,710 | $1,140 | $4,570 |
| 2016 | $491 | $4,450 | $890 | $3,560 |
| 2015 | $462 | $3,330 | $660 | $2,670 |
Source: Public Records
Map
Nearby Homes
- 1010 E Chipman Rd
- 1135 E Chipman Rd
- 5034 S 11th Place
- 4016 S 12th St Unit 21
- 832 E Roeser Rd
- 4624 S 9th St
- 1250 E Roeser Rd
- 710 E Atlanta Ave
- 5222 S 13th Way Unit 3
- 1409 E Bloch Rd
- 5011 S 6th Way
- 1415 E Chipman Rd
- 5629 S 11th Place
- 4439 S 6th St
- 502 E Roeser Rd
- 5436 S 7th St
- 5129 S 15th Place
- 1105 E Wong Way
- 1344 E Pueblo Ave
- 4003 S 12th St Unit 1
- 4852 S 11th St
- 1021 E Romley Ave
- 4856 S 11th St
- 1017 E Romley Ave
- 4860 S 11th St
- 1026 E Romley Ave
- 1022 E Romley Ave
- 1017 E Romley Rd
- 4929 S 11th St
- 4925 S 11th St
- 1018 E Romley Ave
- 4941 S 11th St
- 1013 E Romley Ave
- 4933 S 11th St
- 4937 S 11th St
- 4921 S 11th St
- 1009 E Romley Ave
- 1025 E Chipman Rd
- 1010 E Romley Ave
- 1021 E Chipman Rd
Your Personal Tour Guide
Ask me questions while you tour the home.