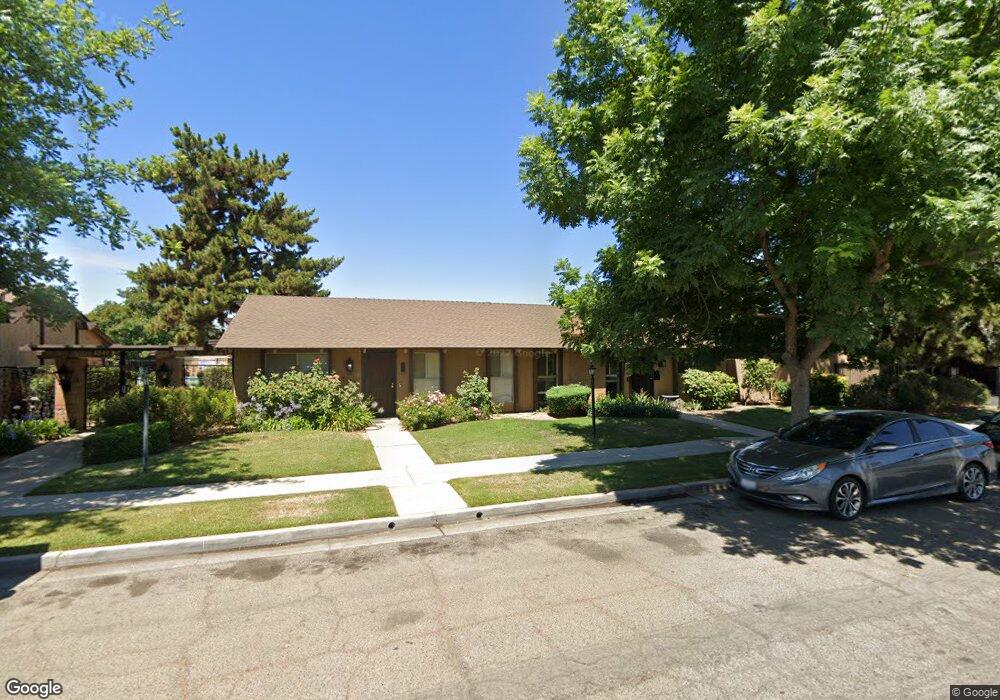
4849 N 7th St Unit K Fresno, CA 93726
Hoover NeighborhoodEstimated Value: $182,000 - $230,000
2
Beds
1
Bath
960
Sq Ft
$212/Sq Ft
Est. Value
About This Home
This home is located at 4849 N 7th St Unit K, Fresno, CA 93726 and is currently estimated at $203,143, approximately $211 per square foot. 4849 N 7th St Unit K is a home located in Fresno County with nearby schools including Thomas Elementary School, Tioga Middle School, and Herbert Hoover High School.
Ownership History
Date
Name
Owned For
Owner Type
Purchase Details
Closed on
Dec 6, 2002
Sold by
Croxon Julia Ree
Bought by
Croxon Julia Ree
Current Estimated Value
Home Financials for this Owner
Home Financials are based on the most recent Mortgage that was taken out on this home.
Original Mortgage
$7,004
Outstanding Balance
$2,950
Interest Rate
5.97%
Estimated Equity
$200,193
Purchase Details
Closed on
Aug 10, 2001
Sold by
Mckinley Martha E
Bought by
Croxon Julia Ree
Purchase Details
Closed on
Nov 30, 1994
Sold by
Mckinley Martha E and Parks Greg
Bought by
Mckinley Martha E
Purchase Details
Closed on
Feb 7, 1994
Sold by
Crowley Gerard
Bought by
Crowley Gerard J and Crowley Rita M
Purchase Details
Closed on
Nov 29, 1993
Sold by
Mckinley Martha E
Bought by
Mckinley Martha E
Create a Home Valuation Report for This Property
The Home Valuation Report is an in-depth analysis detailing your home's value as well as a comparison with similar homes in the area
Home Values in the Area
Average Home Value in this Area
Purchase History
| Date | Buyer | Sale Price | Title Company |
|---|---|---|---|
| Croxon Julia Ree | -- | Chicago Title Co | |
| Croxon Julia Ree | $58,000 | Financial Title Company | |
| Mckinley Martha E | $51,921 | Central Title Company | |
| Crowley Gerard J | $54,500 | First American Title Ins Co | |
| Mckinley Martha E | -- | -- |
Source: Public Records
Mortgage History
| Date | Status | Borrower | Loan Amount |
|---|---|---|---|
| Open | Croxon Julia Ree | $7,004 |
Source: Public Records
Tax History Compared to Growth
Tax History
| Year | Tax Paid | Tax Assessment Tax Assessment Total Assessment is a certain percentage of the fair market value that is determined by local assessors to be the total taxable value of land and additions on the property. | Land | Improvement |
|---|---|---|---|---|
| 2025 | $560 | $49,991 | $12,875 | $37,116 |
| 2023 | $560 | $48,052 | $12,376 | $35,676 |
| 2022 | $539 | $47,111 | $12,134 | $34,977 |
| 2021 | $523 | $46,189 | $11,897 | $34,292 |
| 2020 | $520 | $45,717 | $11,776 | $33,941 |
| 2019 | $500 | $44,822 | $11,546 | $33,276 |
| 2018 | $488 | $43,944 | $11,320 | $32,624 |
| 2017 | $478 | $43,084 | $11,099 | $31,985 |
| 2016 | $461 | $42,240 | $10,882 | $31,358 |
| 2015 | $453 | $41,606 | $10,719 | $30,887 |
| 2014 | $444 | $40,792 | $10,510 | $30,282 |
Source: Public Records
Map
Nearby Homes
- 4849 N 7th St Unit F
- 4849 N 7th St Unit E
- 4909 N 7th St Unit T
- 4909 N 7th St Unit S
- 4919 N Millbrook Ave Unit 113
- 4755 N Cedar Ave Unit 104
- 3919 E Pico Ave
- 4779 N Cedar Ave Unit 109
- 3365 E Fairmont Ave
- 3357 E Fairmont Ave
- 3345 E Fairmont Ave
- 3816 E Donner Ave
- 3508 E Norwich Ave
- 1214 E San Ramon Ave
- 3836 E Richert Ave
- 5474 N 7th St
- 5112 N Sherman Ave
- 5435 N Bond St
- 4561 E Norwich Ave
- 4295 N Archie Ave
- 4849 N 7th St Unit : P
- 4849 N 7th St
- 4849 N 7th St Unit L
- 4849 N 7th St Unit D
- 4849 N 7th St Unit H
- 4849 N 7th St Unit G
- 4849 N 7th St Unit J
- 4849 N 7th St Unit A
- 4849 N 7th St Unit B
- 4849 N 7th St Unit R
- 4849 N 7th St Unit P
- 4849 N 7th St Unit N
- 4849 N 7th St Unit M
- 3819 E Alamos Ave Unit A
- 3819 E Alamos Ave Unit B
- 3819 E Alamos Ave Unit C
- 3819 E Alamos Ave Unit D
- 3829 E Alamos Ave Unit A
- 4919 N 7th St Unit B
- 4919 N 7th St Unit A