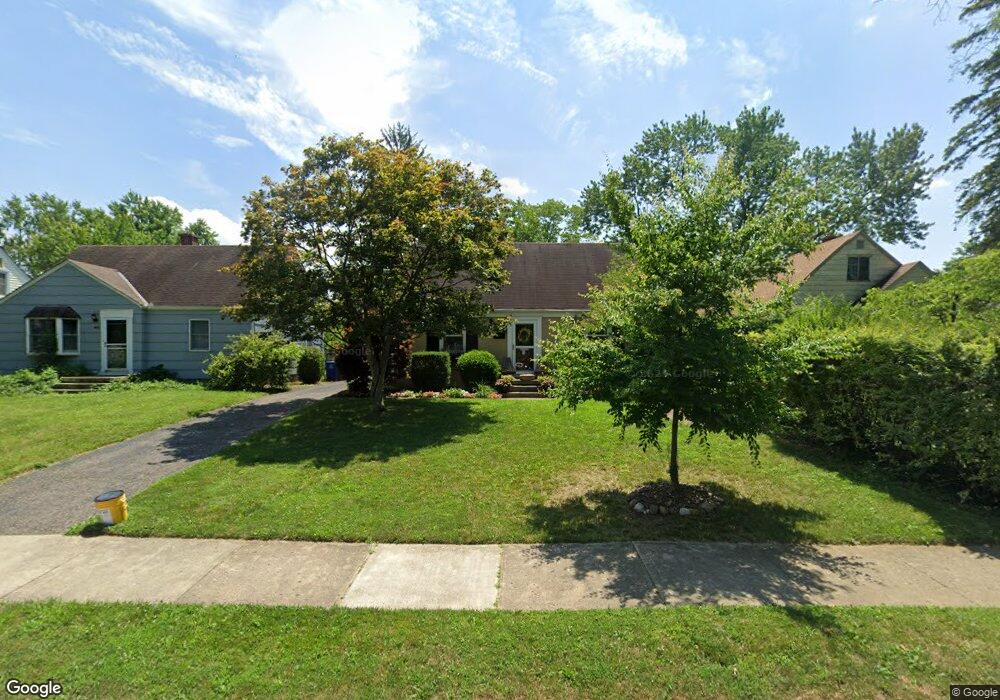
485 Blenheim Rd Columbus, OH 43214
Clintonville NeighborhoodEstimated Value: $380,446 - $407,000
3
Beds
1
Bath
1,110
Sq Ft
$358/Sq Ft
Est. Value
About This Home
This home is located at 485 Blenheim Rd, Columbus, OH 43214 and is currently estimated at $397,362, approximately $357 per square foot. 485 Blenheim Rd is a home located in Franklin County with nearby schools including Indian Springs Elementary School, Dominion Middle School, and Whetstone High School.
Ownership History
Date
Name
Owned For
Owner Type
Purchase Details
Closed on
Aug 13, 2021
Sold by
Walter Joseph R and Walter Cheryl A
Bought by
Walter Joseph R and Walter Cheryl A
Current Estimated Value
Purchase Details
Closed on
Aug 30, 2013
Sold by
Snyder Robert G
Bought by
Walter Joseph R and Walter Cheryl A
Home Financials for this Owner
Home Financials are based on the most recent Mortgage that was taken out on this home.
Original Mortgage
$151,200
Outstanding Balance
$112,337
Interest Rate
4.29%
Mortgage Type
Purchase Money Mortgage
Estimated Equity
$285,025
Purchase Details
Closed on
Jun 30, 2010
Sold by
Evans Frank C and Atkinson Nancy A
Bought by
Snyder Robert G
Home Financials for this Owner
Home Financials are based on the most recent Mortgage that was taken out on this home.
Original Mortgage
$148,006
Interest Rate
4.75%
Mortgage Type
FHA
Purchase Details
Closed on
May 10, 2006
Sold by
Evans Mary F
Bought by
Evans Mary F and The Mary F Evans Trust
Create a Home Valuation Report for This Property
The Home Valuation Report is an in-depth analysis detailing your home's value as well as a comparison with similar homes in the area
Home Values in the Area
Average Home Value in this Area
Purchase History
| Date | Buyer | Sale Price | Title Company |
|---|---|---|---|
| Walter Joseph R | -- | None Available | |
| Walter Joseph R | $168,000 | None Available | |
| Snyder Robert G | $150,000 | Attorney | |
| Evans Mary F | -- | None Available |
Source: Public Records
Mortgage History
| Date | Status | Borrower | Loan Amount |
|---|---|---|---|
| Open | Walter Joseph R | $151,200 | |
| Previous Owner | Snyder Robert G | $148,006 |
Source: Public Records
Tax History Compared to Growth
Tax History
| Year | Tax Paid | Tax Assessment Tax Assessment Total Assessment is a certain percentage of the fair market value that is determined by local assessors to be the total taxable value of land and additions on the property. | Land | Improvement |
|---|---|---|---|---|
| 2024 | $5,250 | $116,980 | $53,520 | $63,460 |
| 2023 | $5,183 | $116,970 | $53,515 | $63,455 |
| 2022 | $5,054 | $97,450 | $34,900 | $62,550 |
| 2021 | $5,063 | $97,450 | $34,900 | $62,550 |
| 2020 | $5,070 | $97,450 | $34,900 | $62,550 |
| 2019 | $4,502 | $74,210 | $26,850 | $47,360 |
| 2018 | $4,063 | $74,210 | $26,850 | $47,360 |
| 2017 | $4,250 | $74,210 | $26,850 | $47,360 |
| 2016 | $4,002 | $60,410 | $21,980 | $38,430 |
| 2015 | $3,633 | $60,410 | $21,980 | $38,430 |
| 2014 | $3,642 | $60,410 | $21,980 | $38,430 |
| 2013 | $1,711 | $57,540 | $20,930 | $36,610 |
Source: Public Records
Map
Nearby Homes
- 541 Northridge Rd
- 374 Acton Rd
- 685 Yaronia Dr N
- 540 Fallis Rd
- 340 Canyon Dr S
- 4000 Indianola Ave
- 217 Arden Rd
- 467 Brevoort Rd
- 4193 Eastlea Dr
- 128 Blenheim Rd
- 780 Moon Rd
- 4266 Fairoaks Dr
- 4299 Colerain Ave
- 197 E Cooke Rd
- 3724 Eisenhower Rd
- 3726 N High St
- 924 Northridge Rd
- 958 Janet Dr
- 886 Carolyn Ave
- 876 Lenore Ave
- 477 Blenheim Rd
- 495 Blenheim Rd
- 503 Blenheim Rd
- 471 Blenheim Rd
- 476 Northridge Rd
- 470 Northridge Rd
- 486 Northridge Rd
- 509 Blenheim Rd
- 465 Blenheim Rd
- 494 Northridge Rd
- 464 Northridge Rd
- 484 Blenheim Rd
- 494 Blenheim Rd
- 500 Northridge Rd
- 515 Blenheim Rd
- 459 Blenheim Rd
- 478 Blenheim Rd
- 472 Blenheim Rd
- 508 Blenheim Rd
- 506 Northridge Rd