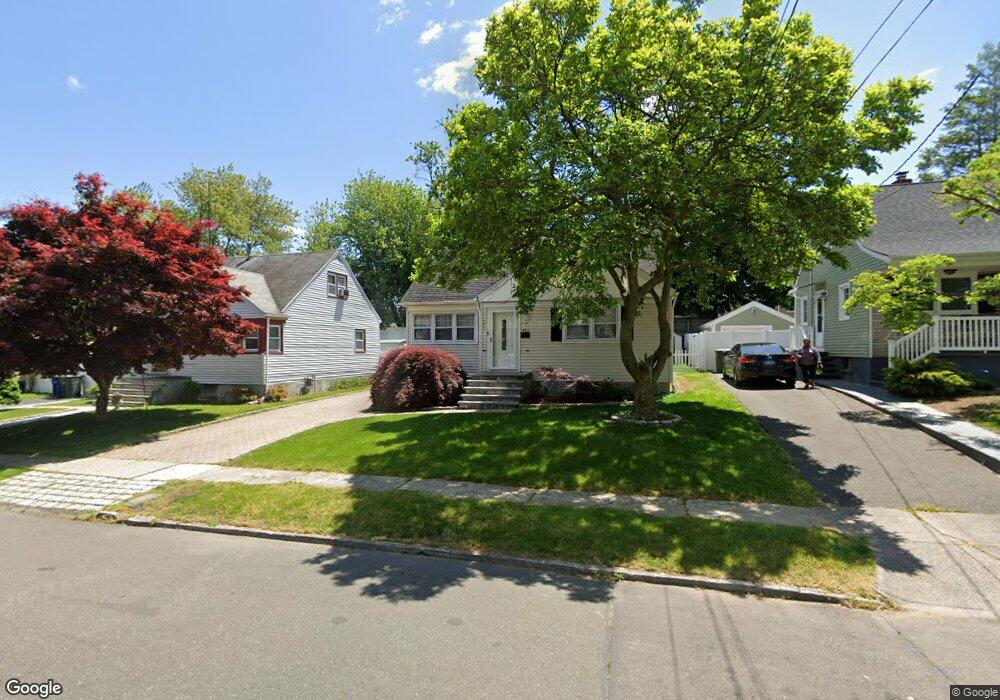
485 Burnsford Ave Bridgeport, CT 06606
North End NeighborhoodEstimated Value: $365,000 - $424,000
3
Beds
1
Bath
1,196
Sq Ft
$328/Sq Ft
Est. Value
About This Home
This home is located at 485 Burnsford Ave, Bridgeport, CT 06606 and is currently estimated at $391,872, approximately $327 per square foot. 485 Burnsford Ave is a home located in Fairfield County with nearby schools including Blackham School, Central High School, and Assumption Catholic School.
Ownership History
Date
Name
Owned For
Owner Type
Purchase Details
Closed on
Jul 14, 2011
Sold by
Us Bank Na
Bought by
Sotelo Alfredo
Current Estimated Value
Home Financials for this Owner
Home Financials are based on the most recent Mortgage that was taken out on this home.
Original Mortgage
$113,936
Outstanding Balance
$78,643
Interest Rate
4.58%
Estimated Equity
$313,229
Purchase Details
Closed on
Jun 15, 2010
Sold by
Gil Kelly
Bought by
Us Bk
Purchase Details
Closed on
Nov 8, 2005
Sold by
Deoliveira Edson and Passos Alessandra
Bought by
Gil Kelly
Purchase Details
Closed on
Feb 22, 2002
Sold by
Merlonghi Marcello and Merlonghi Wanda
Bought by
Deoliveira Edson and Passos Alessandra S
Purchase Details
Closed on
Feb 18, 2000
Sold by
Cappello George J
Bought by
Merlonghi Marcello
Create a Home Valuation Report for This Property
The Home Valuation Report is an in-depth analysis detailing your home's value as well as a comparison with similar homes in the area
Home Values in the Area
Average Home Value in this Area
Purchase History
| Date | Buyer | Sale Price | Title Company |
|---|---|---|---|
| Sotelo Alfredo | $116,900 | -- | |
| Sotelo Alfredo | $116,900 | -- | |
| Us Bk | -- | -- | |
| Us Bk | -- | -- | |
| Gil Kelly | $275,000 | -- | |
| Gil Kelly | $275,000 | -- | |
| Deoliveira Edson | $146,200 | -- | |
| Deoliveira Edson | $146,200 | -- | |
| Merlonghi Marcello | $102,000 | -- | |
| Merlonghi Marcello | $102,000 | -- |
Source: Public Records
Mortgage History
| Date | Status | Borrower | Loan Amount |
|---|---|---|---|
| Open | Merlonghi Marcello | $113,936 | |
| Closed | Merlonghi Marcello | $113,936 |
Source: Public Records
Tax History Compared to Growth
Tax History
| Year | Tax Paid | Tax Assessment Tax Assessment Total Assessment is a certain percentage of the fair market value that is determined by local assessors to be the total taxable value of land and additions on the property. | Land | Improvement |
|---|---|---|---|---|
| 2025 | $6,162 | $141,810 | $75,310 | $66,500 |
| 2024 | $6,162 | $141,810 | $75,310 | $66,500 |
| 2023 | $6,162 | $141,810 | $75,310 | $66,500 |
| 2022 | $6,162 | $141,810 | $75,310 | $66,500 |
| 2021 | $6,162 | $141,810 | $75,310 | $66,500 |
| 2020 | $5,311 | $98,370 | $43,270 | $55,100 |
| 2019 | $5,311 | $98,370 | $43,270 | $55,100 |
| 2018 | $5,348 | $98,370 | $43,270 | $55,100 |
| 2017 | $5,348 | $98,370 | $43,270 | $55,100 |
| 2016 | $5,348 | $98,370 | $43,270 | $55,100 |
| 2015 | $5,578 | $132,170 | $49,980 | $82,190 |
| 2014 | $5,578 | $132,170 | $49,980 | $82,190 |
Source: Public Records
Map
Nearby Homes
- 604 Birmingham St
- 605 Merritt St
- 375 Ruth St
- 520 Savoy St
- 720 Queen St
- 214 Burnsford Ave
- 783 Clark St
- 38 Enid St Unit B
- 184 Merritt St
- 376 Savoy St
- 932 Thorme St
- 485 Westfield Ave
- 495 Peet St
- 113 Clark St
- 681 Westfield Ave
- 533 Glendale Ave
- 81 Ameridge Dr
- 1095 Wayne St
- 234 Savoy St
- 245 Glendale Ave Unit D8
- 495 Burnsford Ave
- 475 Burnsford Ave
- 465 Burnsford Ave
- 505 Burnsford Ave
- 582 Birmingham St
- 574 Birmingham St
- 465 Burnsford Ave
- 486 Burnsford Ave
- 455 Burnsford Ave
- 515 Burnsford Ave
- 476 Burnsford Ave
- 496 Burnsford Ave
- 560 Birmingham St
- 466 Burnsford Ave
- 506 Burnsford Ave
- 550 Birmingham St
- 445 Burnsford Ave Unit 447
- 525 Burnsford Ave
- 445-447 Burnsford Ave