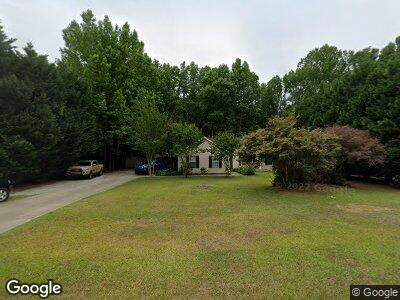
485 Hayward Bishop Way Senoia, GA 30276
Estimated Value: $287,000 - $343,000
3
Beds
2
Baths
1,529
Sq Ft
$207/Sq Ft
Est. Value
About This Home
This home is located at 485 Hayward Bishop Way, Senoia, GA 30276 and is currently estimated at $317,009, approximately $207 per square foot. 485 Hayward Bishop Way is a home located in Coweta County with nearby schools including Poplar Road Elementary School, East Coweta Middle School, and East Coweta High School.
Ownership History
Date
Name
Owned For
Owner Type
Purchase Details
Closed on
Aug 22, 2014
Sold by
Bennett Ronald K
Bought by
Bennett Kelley J
Current Estimated Value
Purchase Details
Closed on
Sep 17, 1999
Sold by
David Lindsey Homes Inc
Bought by
Bennett Ronald K and Bennett Kelley J
Home Financials for this Owner
Home Financials are based on the most recent Mortgage that was taken out on this home.
Original Mortgage
$98,600
Interest Rate
7.91%
Mortgage Type
New Conventional
Purchase Details
Closed on
Jul 22, 1998
Bought by
David Lindsey Homes
Purchase Details
Closed on
Aug 17, 1995
Bought by
Mcknight P R
Purchase Details
Closed on
Nov 30, 1983
Bought by
Mcknight P R
Create a Home Valuation Report for This Property
The Home Valuation Report is an in-depth analysis detailing your home's value as well as a comparison with similar homes in the area
Home Values in the Area
Average Home Value in this Area
Purchase History
| Date | Buyer | Sale Price | Title Company |
|---|---|---|---|
| Bennett Kelley J | -- | -- | |
| Bennett Ronald K | $97,700 | -- | |
| David Lindsey Homes | $577,500 | -- | |
| Mcknight P R | -- | -- | |
| Mcknight P R | -- | -- |
Source: Public Records
Mortgage History
| Date | Status | Borrower | Loan Amount |
|---|---|---|---|
| Previous Owner | Bennett Ronald K | $2,793 | |
| Previous Owner | Bennett Ronald K | $10,691 | |
| Previous Owner | Bennett Kelley J | $11,100 | |
| Previous Owner | Bennett Ronald K | $11,684 | |
| Previous Owner | Bennett Ronald K | $101,744 | |
| Previous Owner | Bennett Ronald K | $98,600 |
Source: Public Records
Tax History Compared to Growth
Tax History
| Year | Tax Paid | Tax Assessment Tax Assessment Total Assessment is a certain percentage of the fair market value that is determined by local assessors to be the total taxable value of land and additions on the property. | Land | Improvement |
|---|---|---|---|---|
| 2023 | $2,537 | $101,504 | $20,000 | $81,504 |
| 2022 | $2,126 | $90,997 | $20,000 | $70,997 |
| 2021 | $1,859 | $75,283 | $16,000 | $59,283 |
| 2020 | $1,749 | $70,710 | $16,000 | $54,710 |
| 2019 | $1,401 | $52,677 | $10,000 | $42,677 |
| 2018 | $1,404 | $52,677 | $10,000 | $42,677 |
| 2017 | $1,297 | $49,019 | $10,000 | $39,019 |
| 2016 | $1,204 | $46,276 | $10,000 | $36,276 |
| 2015 | $1,108 | $43,532 | $10,000 | $33,532 |
| 2014 | $804 | $38,484 | $8,000 | $30,484 |
Source: Public Records
Map
Nearby Homes
- 395 Hayward Bishop Way
- 95 Old Mill Way Unit 2
- 115 Old Mill Way Unit 3
- 135 Old Mill Way Unit 4
- 733 Elders Mill Rd
- 49 Ellabelle Ct
- 166 Belvoir Place
- 111 Rockhouse Ridge
- 200 Cushing St Unit 116
- 180 Cushing St Unit 120
- 130 Putney Way
- 300 Cushing St
- 746 Linch Rd
- 45 Cushing St Unit 156
- 55 Cushing St Unit 157
- 129 Rutland Ct
- 150 Wagon Wheel Trail
- 270 Kenwood Trail
- 300 Kenwood Trail
- 165 Wagon Wheel Trail
- 485 Hayward Bishop Way
- 495 Hayward Bishop Way
- 475 Hayward Bishop Way
- 505 Hayward Bishop Way
- 465 Hayward Bishop Way
- 455 Hayward Bishop Way
- 515 Hayward Bishop Way Unit D-16
- 515 Hayward Bishop Way
- 490 Hayward Bishop Way
- 500 Hayward Bishop Way
- 480 Hayward Bishop Way
- 525 Hayward Bishop Way
- 510 Hayward Bishop Way
- 460 Hayward Bishop Way
- 470 Hayward Bishop Way
- 470 Hayward Bishop Way
- 520 Hayward Bishop Way
- 445 Hayward Bishop Way
- 535 Hayward Bishop Way
- 530 Hayward Bishop Way