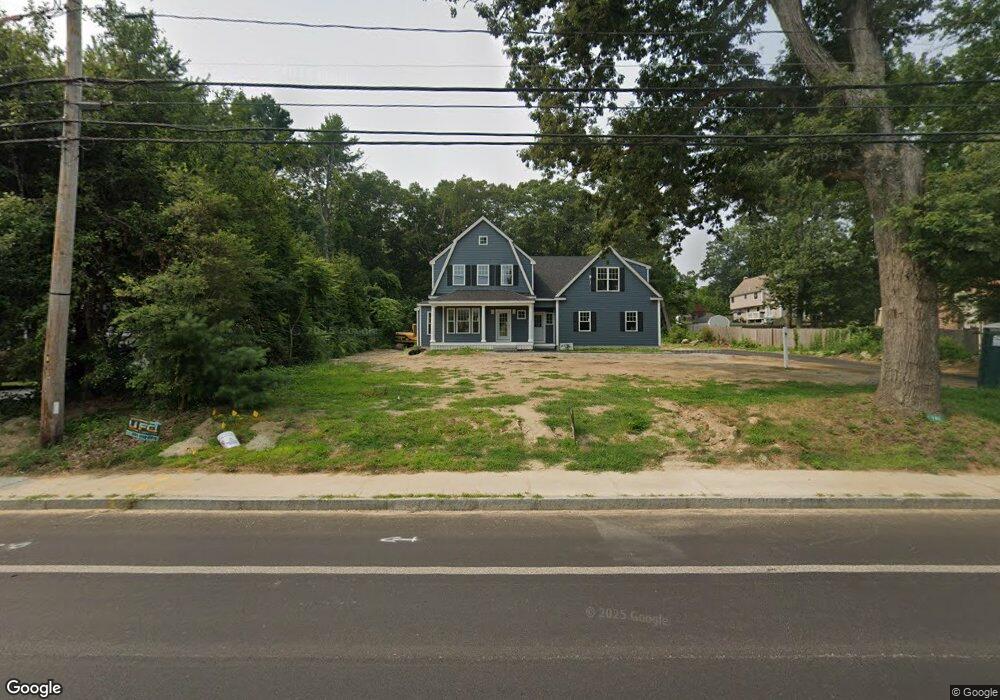
485 Main St Unit 2 Millis, MA 02054
Estimated Value: $895,000 - $962,000
1
Bed
1
Bath
550
Sq Ft
$1,703/Sq Ft
Est. Value
About This Home
This home is located at 485 Main St Unit 2, Millis, MA 02054 and is currently estimated at $936,913, approximately $1,703 per square foot. 485 Main St Unit 2 is a home located in Norfolk County with nearby schools including Clyde F Brown, Millis Middle School, and Millis High School.
Ownership History
Date
Name
Owned For
Owner Type
Purchase Details
Closed on
Oct 22, 2025
Sold by
Mcdonough Building Inc
Bought by
Kornack Michelle
Current Estimated Value
Home Financials for this Owner
Home Financials are based on the most recent Mortgage that was taken out on this home.
Original Mortgage
$760,000
Outstanding Balance
$756,650
Interest Rate
5.5%
Mortgage Type
Purchase Money Mortgage
Estimated Equity
$180,263
Purchase Details
Closed on
Nov 9, 1995
Sold by
Power James T and Power Mary R
Bought by
Mcdonough Bldg Inc
Home Financials for this Owner
Home Financials are based on the most recent Mortgage that was taken out on this home.
Original Mortgage
$100,000
Interest Rate
7.62%
Mortgage Type
Purchase Money Mortgage
Create a Home Valuation Report for This Property
The Home Valuation Report is an in-depth analysis detailing your home's value as well as a comparison with similar homes in the area
Home Values in the Area
Average Home Value in this Area
Purchase History
| Date | Buyer | Sale Price | Title Company |
|---|---|---|---|
| Kornack Michelle | $950,000 | -- | |
| Mcdonough Bldg Inc | $78,000 | -- |
Source: Public Records
Mortgage History
| Date | Status | Borrower | Loan Amount |
|---|---|---|---|
| Open | Kornack Michelle | $760,000 | |
| Previous Owner | Mcdonough Bldg Inc | $100,000 |
Source: Public Records
Tax History
| Year | Tax Paid | Tax Assessment Tax Assessment Total Assessment is a certain percentage of the fair market value that is determined by local assessors to be the total taxable value of land and additions on the property. | Land | Improvement |
|---|---|---|---|---|
| 2025 | $3,531 | $215,300 | $187,600 | $27,700 |
| 2024 | $7,847 | $477,900 | $187,600 | $290,300 |
| 2023 | $8,040 | $459,700 | $163,200 | $296,500 |
| 2022 | $8,288 | $439,000 | $163,200 | $275,800 |
| 2021 | $7,461 | $380,300 | $163,200 | $217,100 |
| 2020 | $7,156 | $355,300 | $152,500 | $202,800 |
| 2019 | $6,476 | $346,300 | $143,500 | $202,800 |
| 2018 | $6,006 | $333,300 | $130,500 | $202,800 |
| 2017 | $5,815 | $315,700 | $128,200 | $187,500 |
| 2016 | $5,506 | $315,700 | $128,200 | $187,500 |
| 2015 | $5,367 | $315,700 | $128,200 | $187,500 |
Source: Public Records
Map
Nearby Homes
Your Personal Tour Guide
Ask me questions while you tour the home.