Estimated Value: $155,000 - $169,000
3
Beds
1
Bath
864
Sq Ft
$189/Sq Ft
Est. Value
About This Home
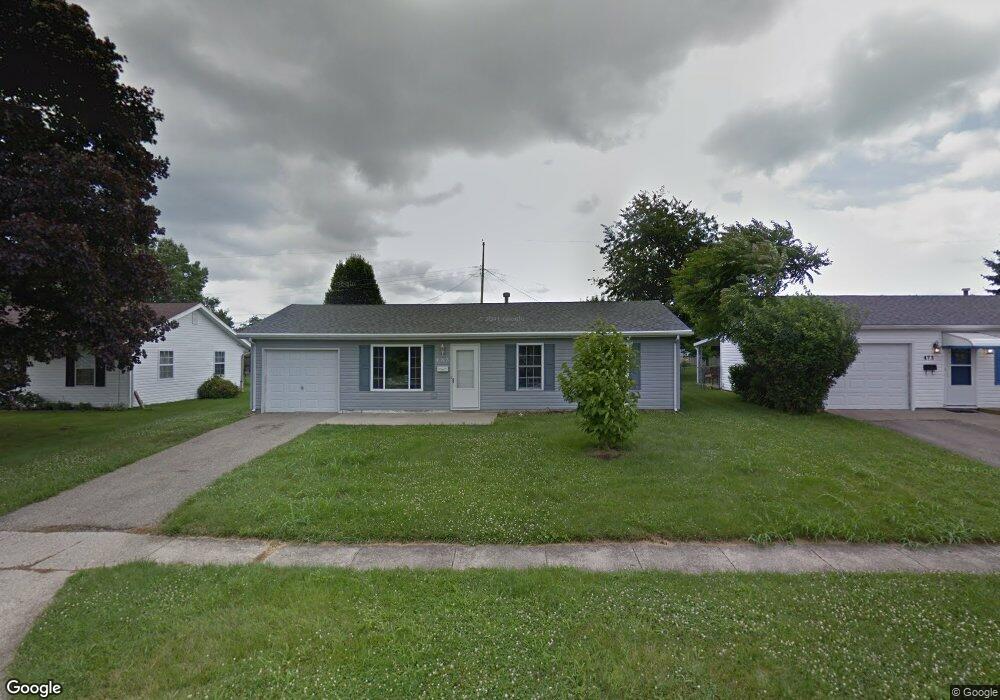
This home is located at 485 Richard Dr, Xenia, OH 45385 and is currently estimated at $163,503, approximately $189 per square foot. 485 Richard Dr is a home located in Greene County with nearby schools including Xenia High School, Summit Academy Community School for Alternative Learners - Xenia, and Legacy Christian Academy.
Ownership History
Date
Name
Owned For
Owner Type
Purchase Details
Closed on
Sep 11, 2018
Sold by
Rinehart Richard E and Rinehart Melinda D
Bought by
Wilson Jennifer R
Current Estimated Value
Home Financials for this Owner
Home Financials are based on the most recent Mortgage that was taken out on this home.
Original Mortgage
$88,369
Outstanding Balance
$77,849
Interest Rate
4.6%
Mortgage Type
FHA
Estimated Equity
$85,654
Purchase Details
Closed on
Oct 4, 2001
Sold by
Doll Terri L and Doll Terri L
Bought by
Rinehart Richard E and Rinehart Melinda D
Home Financials for this Owner
Home Financials are based on the most recent Mortgage that was taken out on this home.
Original Mortgage
$77,500
Interest Rate
6.92%
Create a Home Valuation Report for This Property
The Home Valuation Report is an in-depth analysis detailing your home's value as well as a comparison with similar homes in the area
Home Values in the Area
Average Home Value in this Area
Purchase History
| Date | Buyer | Sale Price | Title Company |
|---|---|---|---|
| Wilson Jennifer R | $90,000 | Hallmark Title | |
| Rinehart Richard E | $79,900 | -- |
Source: Public Records
Mortgage History
| Date | Status | Borrower | Loan Amount |
|---|---|---|---|
| Open | Wilson Jennifer R | $3,592 | |
| Closed | Wilson Jennifer R | $2,858 | |
| Open | Wilson Jennifer R | $88,369 | |
| Previous Owner | Rinehart Melinda D | $89,294 | |
| Previous Owner | Rinehart Richard E | $70,400 | |
| Previous Owner | Rinehart Richard E | $17,600 | |
| Previous Owner | Rinehart Richard E | $77,500 |
Source: Public Records
Tax History Compared to Growth
Tax History
| Year | Tax Paid | Tax Assessment Tax Assessment Total Assessment is a certain percentage of the fair market value that is determined by local assessors to be the total taxable value of land and additions on the property. | Land | Improvement |
|---|---|---|---|---|
| 2024 | $1,734 | $41,580 | $9,750 | $31,830 |
| 2023 | $1,734 | $41,580 | $9,750 | $31,830 |
| 2022 | $1,416 | $28,950 | $6,970 | $21,980 |
| 2021 | $1,435 | $28,950 | $6,970 | $21,980 |
| 2020 | $1,373 | $28,950 | $6,970 | $21,980 |
| 2019 | $1,345 | $26,630 | $4,690 | $21,940 |
| 2018 | $1,350 | $26,630 | $4,690 | $21,940 |
| 2017 | $1,301 | $26,630 | $4,690 | $21,940 |
| 2016 | $1,302 | $25,260 | $4,690 | $20,570 |
| 2015 | $1,305 | $25,260 | $4,690 | $20,570 |
| 2014 | $1,249 | $25,260 | $4,690 | $20,570 |
Source: Public Records
Map
Nearby Homes
- 1351 Omard Dr
- 343 Sheelin Rd
- 912 Omard Dr
- 883 Omard Dr
- 1391 June Dr
- 1283 June Dr
- 1233 June Dr
- 1223 June Dr
- 509 Antrim Rd
- 1342 Kylemore Dr
- 121 S Progress Dr
- Harmony Plan at Grandstone Trace
- Newcastle Plan at Grandstone Trace
- Pendleton Plan at Grandstone Trace
- Bellamy Plan at Grandstone Trace
- Chatham Plan at Grandstone Trace
- 523 Hollywood Blvd
- 532 Hollywood Blvd
- 517 Hollywood Blvd
- 1796 Palmer Ct