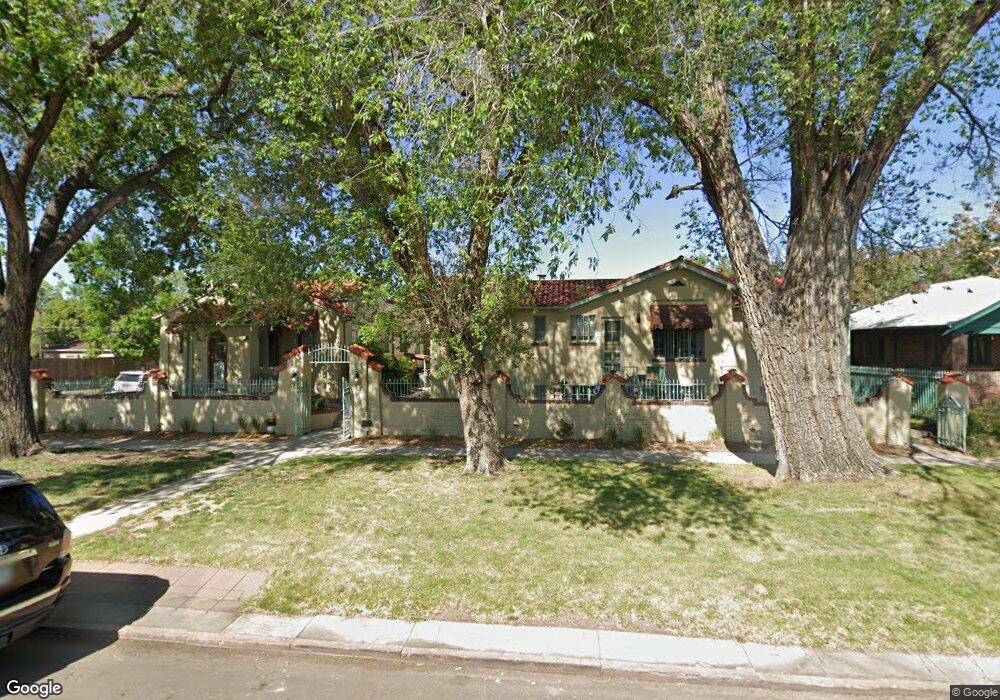
485 S Logan St Unit 2 Denver, CO 80209
Washington Park West NeighborhoodEstimated Value: $260,000 - $346,000
1
Bed
1
Bath
564
Sq Ft
$512/Sq Ft
Est. Value
About This Home
This home is located at 485 S Logan St Unit 2, Denver, CO 80209 and is currently estimated at $288,895, approximately $512 per square foot. 485 S Logan St Unit 2 is a home located in Denver County with nearby schools including Lincoln Elementary School, Grant Beacon Middle School, and South High School.
Ownership History
Date
Name
Owned For
Owner Type
Purchase Details
Closed on
Jun 23, 2017
Sold by
Gaines Pamela
Bought by
Miret John Thomas Deza
Current Estimated Value
Home Financials for this Owner
Home Financials are based on the most recent Mortgage that was taken out on this home.
Original Mortgage
$211,850
Outstanding Balance
$175,876
Interest Rate
3.95%
Mortgage Type
New Conventional
Estimated Equity
$113,019
Purchase Details
Closed on
Feb 10, 2015
Sold by
Griggs David M
Bought by
Gaines Pamela
Home Financials for this Owner
Home Financials are based on the most recent Mortgage that was taken out on this home.
Original Mortgage
$152,915
Interest Rate
3.92%
Mortgage Type
New Conventional
Purchase Details
Closed on
Jun 26, 2009
Sold by
Yu Stella M Y and Griggs David M
Bought by
Griggs David M
Purchase Details
Closed on
Mar 15, 1999
Sold by
Platte Development Llc
Bought by
Yu Stella M Y and Griggs David M
Create a Home Valuation Report for This Property
The Home Valuation Report is an in-depth analysis detailing your home's value as well as a comparison with similar homes in the area
Home Values in the Area
Average Home Value in this Area
Purchase History
| Date | Buyer | Sale Price | Title Company |
|---|---|---|---|
| Miret John Thomas Deza | $223,000 | Fidelity National Title | |
| Gaines Pamela | $179,900 | Fidelity National Title Ins | |
| Griggs David M | -- | None Available | |
| Yu Stella M Y | $120,000 | -- |
Source: Public Records
Mortgage History
| Date | Status | Borrower | Loan Amount |
|---|---|---|---|
| Open | Miret John Thomas Deza | $211,850 | |
| Previous Owner | Gaines Pamela | $152,915 |
Source: Public Records
Tax History Compared to Growth
Tax History
| Year | Tax Paid | Tax Assessment Tax Assessment Total Assessment is a certain percentage of the fair market value that is determined by local assessors to be the total taxable value of land and additions on the property. | Land | Improvement |
|---|---|---|---|---|
| 2024 | $1,308 | $16,520 | $2,850 | $13,670 |
| 2023 | $1,280 | $16,520 | $2,850 | $13,670 |
| 2022 | $1,414 | $17,780 | $2,960 | $14,820 |
| 2021 | $1,365 | $18,290 | $3,050 | $15,240 |
| 2020 | $1,244 | $16,770 | $2,820 | $13,950 |
| 2019 | $1,209 | $16,770 | $2,820 | $13,950 |
| 2018 | $1,092 | $14,110 | $2,410 | $11,700 |
| 2017 | $1,088 | $14,110 | $2,410 | $11,700 |
| 2016 | $1,075 | $13,180 | $2,181 | $10,999 |
| 2015 | $1,030 | $13,180 | $2,181 | $10,999 |
| 2014 | $963 | $11,600 | $1,361 | $10,239 |
Source: Public Records
Map
Nearby Homes
- 485 S Logan St Unit 11
- 328 E Dakota Ave
- 501 S Pearl St
- 589 S Grant St
- 493 S Lincoln St
- 571 S Sherman St
- 427 S Lincoln St
- 465 S Lincoln St
- 354 S Lincoln St
- 623 S Logan St
- 421 E Alameda Ave
- 260 S Grant St
- 646 S Lincoln St
- 232 S Pennsylvania St Unit 232
- 533 S Emerson St
- 730 S Sherman St
- 525 S Ogden St
- 61 W Alameda Ave
- 35 W Byers Place
- 774 S Grant St
- 485 S Logan St Unit 16
- 485 S Logan St Unit 15
- 485 S Logan St
- 485 S Logan St Unit 12
- 485 S Logan St
- 485 S Logan St
- 485 S Logan St Unit 9
- 485 S Logan St Unit 8
- 485 S Logan St
- 485 S Logan St Unit 6
- 485 S Logan St Unit 5
- 485 S Logan St Unit 4
- 485 S Logan St Unit 3
- 485 S Logan St
- 485 S Logan St Unit 14
- 485 S Logan St Unit 7
- 475 S Logan St
- 467 S Logan St
- 465 S Logan St
- 503 S Logan St