4850 Nelson St Fremont, CA 94538
Sundale NeighborhoodEstimated Value: $1,292,000 - $1,628,000
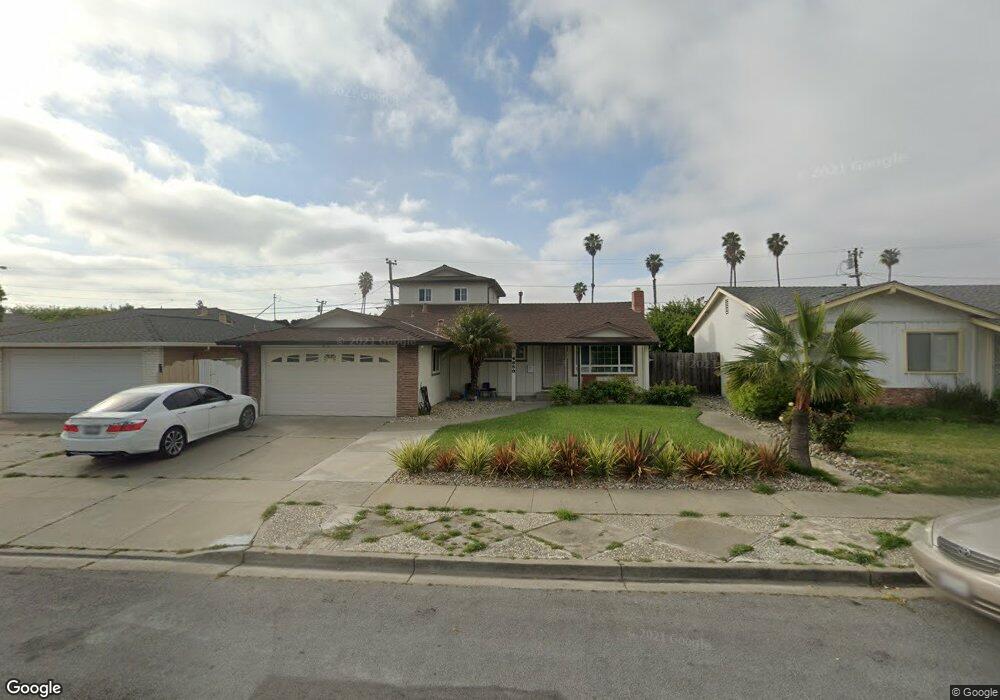
About This Home
This home is located at 4850 Nelson St, Fremont, CA 94538 and is currently estimated at $1,468,436, approximately $907 per square foot. 4850 Nelson St is a home located in Alameda County with nearby schools including Joseph Azevada Elementary School, G.M. Walters Middle School, and John F. Kennedy High School.
Ownership History
We collect this data history from publicly available records. To have your information removed, we recommend requesting removal directly through your county’s website.
Purchase Details
Home Financials for this Owner
Home Financials are based on the most recent Mortgage that was taken out on this home.Purchase Details
Home Values in the Area
Average Home Value in this Area
Purchase History
We collect this data history from publicly available records. To have your information removed, we recommend requesting removal directly through your county’s website.
| Date | Buyer | Sale Price | Title Company |
|---|---|---|---|
| $781,000 | Chicago Title Company | ||
| -- | None Available |
Mortgage History
We collect this data history from publicly available records. To have your information removed, we recommend requesting removal directly through your county’s website.
| Date | Status | Borrower | Loan Amount |
|---|---|---|---|
| Open | $468,600 |
Tax History
We collect this data history from publicly available records. To have your information removed, we recommend requesting removal directly through your county’s website.
| Year | Tax Paid | Tax Assessment Tax Assessment Total Assessment is a certain percentage of the fair market value that is determined by local assessors to be the total taxable value of land and additions on the property. | Land | Improvement |
|---|---|---|---|---|
| 2025 | $10,808 | $899,397 | $348,168 | $558,229 |
| 2024 | $10,808 | $881,629 | $341,343 | $547,286 |
| 2023 | $10,519 | $871,205 | $334,650 | $536,555 |
| 2022 | $10,385 | $847,125 | $328,089 | $526,036 |
| 2021 | $10,129 | $830,380 | $321,657 | $515,723 |
| 2020 | $10,164 | $828,797 | $318,360 | $510,437 |
| 2019 | $10,047 | $812,552 | $312,120 | $500,432 |
| 2018 | $9,850 | $796,620 | $306,000 | $490,620 |
| 2017 | $1,818 | $112,170 | $15,419 | $96,751 |
| 2016 | $1,771 | $109,971 | $15,117 | $94,854 |
| 2015 | $1,734 | $108,319 | $14,890 | $93,429 |
| 2014 | $1,693 | $106,197 | $14,598 | $91,599 |
Map
- 5107 Royal Palm Dr
- 5231 Silver Reef Dr
- 4754 Bret Harte Ct
- 4436 Amador Rd
- 39666 Whitecap Way
- 4403 Amador Rd
- 5589 Roosevelt Place
- 5619 Willkie Place
- 5561 Roundtree Terrace
- 5649 Evergreen Terrace
- 38850 Bonnie Way
- 4265 Tehama Ave
- 4763 Piper St
- 4254 Tehama Ave
- 38811 Bonnie Way
- 5751 Birch Terrace
- 39139 Argonaut Way Unit 107
- 39139 Argonaut Way Unit 104
- 4683 De Silva St
- 5040 Brian Ct
Ask me questions while you tour the home.