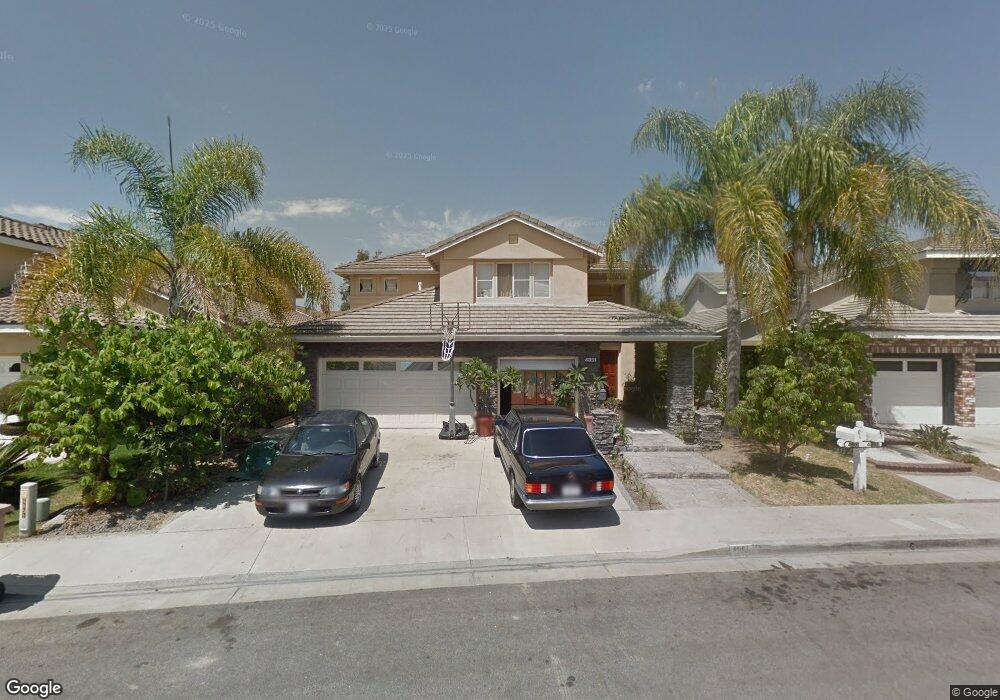
4851 Corso Cir Cypress, CA 90630
Estimated Value: $1,643,718 - $1,977,000
5
Beds
3
Baths
2,901
Sq Ft
$612/Sq Ft
Est. Value
About This Home
This home is located at 4851 Corso Cir, Cypress, CA 90630 and is currently estimated at $1,776,180, approximately $612 per square foot. 4851 Corso Cir is a home located in Orange County with nearby schools including Margaret Landell Elementary School, A.E. Arnold Elementary School, and Lexington Junior High School.
Ownership History
Date
Name
Owned For
Owner Type
Purchase Details
Closed on
Nov 20, 2010
Sold by
To Tila Thanh
Bought by
To Chi Chu
Current Estimated Value
Purchase Details
Closed on
Jun 18, 2008
Sold by
To Ann
Bought by
To Tila Thanh and To Chi Chu
Purchase Details
Closed on
Sep 25, 2001
Sold by
To Ann and To Tila
Bought by
To Ann
Home Financials for this Owner
Home Financials are based on the most recent Mortgage that was taken out on this home.
Original Mortgage
$155,000
Interest Rate
6.9%
Purchase Details
Closed on
Oct 29, 1997
Sold by
To Tho and Thi Lam Thi
Bought by
To Ann and To Tila
Purchase Details
Closed on
May 3, 1994
Sold by
Cypress Homes Inc
Bought by
Tho To Gia and Dung Lam Thi
Home Financials for this Owner
Home Financials are based on the most recent Mortgage that was taken out on this home.
Original Mortgage
$264,650
Interest Rate
8.65%
Create a Home Valuation Report for This Property
The Home Valuation Report is an in-depth analysis detailing your home's value as well as a comparison with similar homes in the area
Home Values in the Area
Average Home Value in this Area
Purchase History
| Date | Buyer | Sale Price | Title Company |
|---|---|---|---|
| To Chi Chu | -- | None Available | |
| To Tila Thanh | -- | None Available | |
| To Ann | -- | First American Title Ins Co | |
| To Ann | -- | -- | |
| Tho To Gia | $350,500 | First American Title Ins Co |
Source: Public Records
Mortgage History
| Date | Status | Borrower | Loan Amount |
|---|---|---|---|
| Previous Owner | To Ann | $155,000 | |
| Previous Owner | Tho To Gia | $264,650 |
Source: Public Records
Tax History
| Year | Tax Paid | Tax Assessment Tax Assessment Total Assessment is a certain percentage of the fair market value that is determined by local assessors to be the total taxable value of land and additions on the property. | Land | Improvement |
|---|---|---|---|---|
| 2025 | $12,157 | $1,112,313 | $611,390 | $500,923 |
| 2024 | $12,157 | $1,090,503 | $599,402 | $491,101 |
| 2023 | $11,883 | $1,069,121 | $587,649 | $481,472 |
| 2022 | $11,752 | $1,048,158 | $576,126 | $472,032 |
| 2021 | $11,597 | $1,027,606 | $564,829 | $462,777 |
| 2020 | $11,554 | $1,017,070 | $559,038 | $458,032 |
| 2019 | $11,219 | $997,128 | $548,077 | $449,051 |
| 2018 | $11,067 | $977,577 | $537,330 | $440,247 |
| 2017 | $10,679 | $958,409 | $526,794 | $431,615 |
| 2016 | $10,591 | $939,617 | $516,465 | $423,152 |
| 2015 | $10,517 | $925,504 | $508,708 | $416,796 |
| 2014 | $10,969 | $882,242 | $484,927 | $397,315 |
Source: Public Records
Map
Nearby Homes
- 9598 Naples Dr
- 4790 Montefino Dr
- 5000 Clementine Ln
- 6007 Clementine Ln Unit 21
- 9432 Alderbury St
- 9011 Cerise Ln Unit 129
- 4811 Myra Ave
- 9001 Cerise Ln Unit 109
- 9001 Cerise Ln Unit 113
- 5258 Hanover Dr
- 4586 Larwin Ave
- 4611 Myra Ave
- 4449 Avenida Granada
- 4811 Newman Ave
- 5353 Cumberland Dr
- 10292 Ethel St
- 4385 Larwin Ave
- 10321 Janice Lynn St
- 9220 Whitney Way
- 5372 Harvard Way
- 4841 Corso Cir
- 4861 Corso Cir
- 4831 Corso Cir
- 4871 Corso Cir
- 4870 Corso Cir
- 4860 Corso Cir
- 4821 Corso Cir
- 4881 Corso Cir
- 4880 Corso Cir
- 4832 Corsica Dr
- 4850 Corso Cir
- 4822 Corsica Dr
- 4812 Corsica Dr
- 4840 Corso Cir
- 4842 Corsica Dr
- 4890 Corso Cir
- 4891 Corso Cir
- 4852 Corsica Dr
- 4817 Tremezzo Dr
- 4807 Tremezzo Dr
Your Personal Tour Guide
Ask me questions while you tour the home.