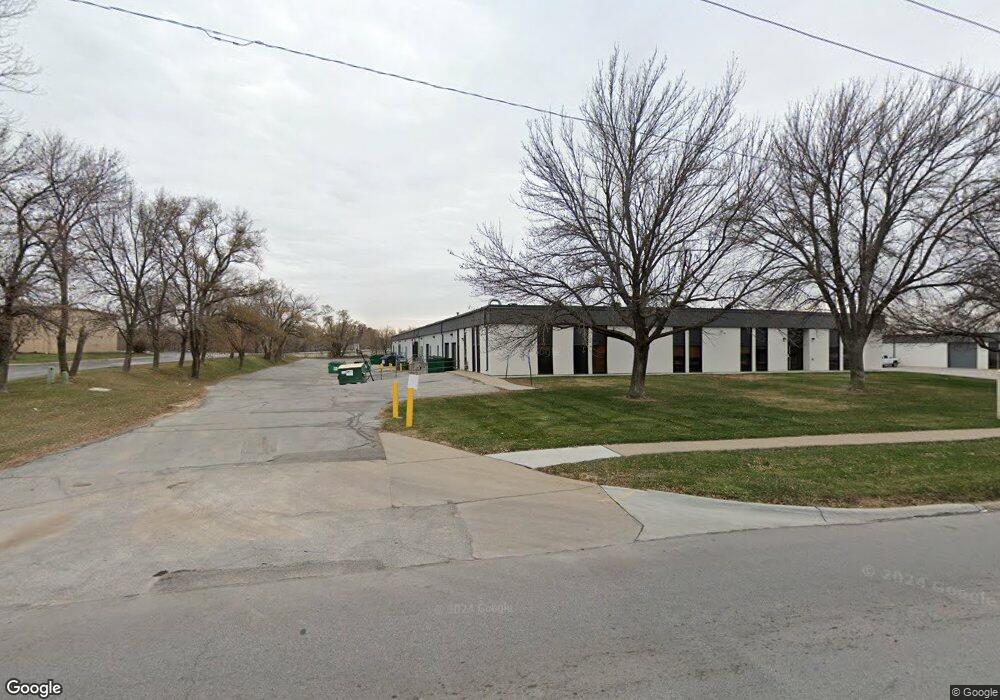
4851 F St Omaha, NE 68117
South Central Omaha NeighborhoodEstimated Value: $6,141,194
--
Bed
--
Bath
39,600
Sq Ft
$155/Sq Ft
Est. Value
About This Home
This home is located at 4851 F St, Omaha, NE 68117 and is currently estimated at $6,141,194, approximately $155 per square foot. 4851 F St is a home located in Douglas County with nearby schools including Ashland Park-Robbins Elementary School, St Thomas More School, and Good Shepherd Lutheran School.
Ownership History
Date
Name
Owned For
Owner Type
Purchase Details
Closed on
Oct 7, 2021
Sold by
Mri-Real Estate Fund Limited Partnership
Bought by
M I I Foxley Llc
Current Estimated Value
Home Financials for this Owner
Home Financials are based on the most recent Mortgage that was taken out on this home.
Original Mortgage
$4,204,882
Outstanding Balance
$3,834,460
Interest Rate
2.8%
Mortgage Type
Future Advance Clause Open End Mortgage
Estimated Equity
$2,306,734
Create a Home Valuation Report for This Property
The Home Valuation Report is an in-depth analysis detailing your home's value as well as a comparison with similar homes in the area
Home Values in the Area
Average Home Value in this Area
Purchase History
| Date | Buyer | Sale Price | Title Company |
|---|---|---|---|
| M I I Foxley Llc | -- | None Listed On Document |
Source: Public Records
Mortgage History
| Date | Status | Borrower | Loan Amount |
|---|---|---|---|
| Open | M I I Foxley Llc | $4,204,882 |
Source: Public Records
Tax History Compared to Growth
Tax History
| Year | Tax Paid | Tax Assessment Tax Assessment Total Assessment is a certain percentage of the fair market value that is determined by local assessors to be the total taxable value of land and additions on the property. | Land | Improvement |
|---|---|---|---|---|
| 2024 | $61,631 | $2,921,200 | $539,400 | $2,381,800 |
| 2023 | $61,631 | $2,921,200 | $539,400 | $2,381,800 |
| 2022 | $52,347 | $2,452,300 | $539,400 | $1,912,900 |
| 2021 | $51,905 | $2,452,300 | $539,400 | $1,912,900 |
| 2020 | $48,128 | $2,248,000 | $197,100 | $2,050,900 |
| 2019 | $35,439 | $1,650,400 | $197,100 | $1,453,300 |
| 2018 | $35,486 | $1,650,400 | $197,100 | $1,453,300 |
| 2017 | $28,754 | $1,650,400 | $197,100 | $1,453,300 |
| 2016 | $28,754 | $1,340,000 | $197,100 | $1,142,900 |
| 2015 | $28,368 | $1,340,000 | $197,100 | $1,142,900 |
| 2014 | $28,368 | $1,340,000 | $197,100 | $1,142,900 |
Source: Public Records
Map
Nearby Homes