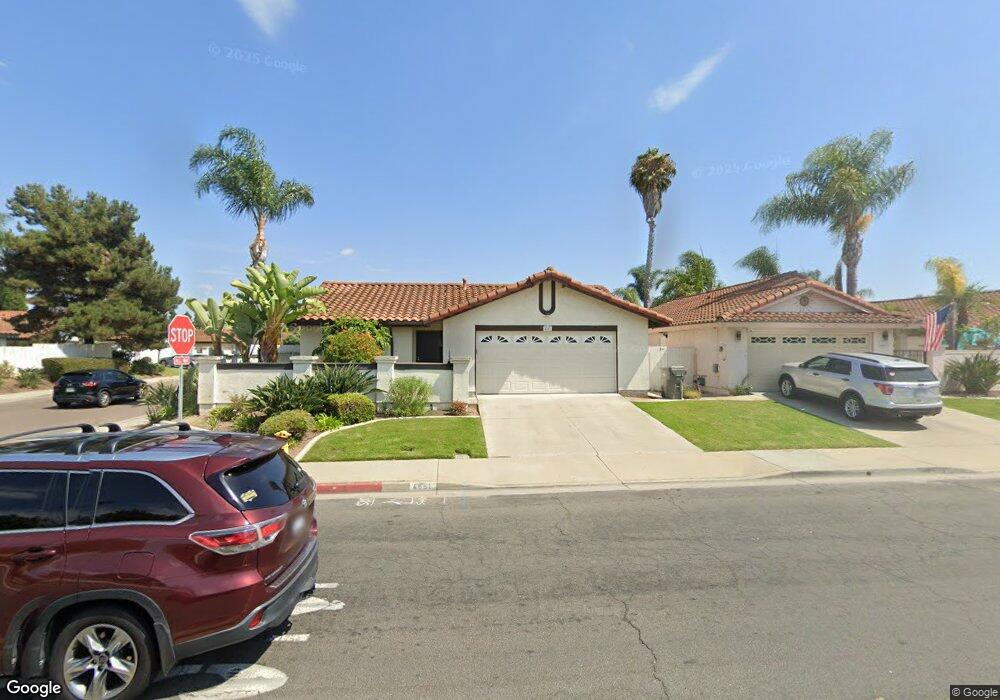
4851 Gardenia St Oceanside, CA 92057
San Luis Rey NeighborhoodEstimated Value: $783,000 - $822,000
4
Beds
2
Baths
1,411
Sq Ft
$564/Sq Ft
Est. Value
About This Home
This home is located at 4851 Gardenia St, Oceanside, CA 92057 and is currently estimated at $796,401, approximately $564 per square foot. 4851 Gardenia St is a home located in San Diego County with nearby schools including Del Rio Elementary School, Cesar Chavez Middle School, and El Camino High School.
Ownership History
Date
Name
Owned For
Owner Type
Purchase Details
Closed on
Apr 5, 2010
Sold by
Pgi Investments Llc
Bought by
Alvarez Valente and Alvarez Maria
Current Estimated Value
Home Financials for this Owner
Home Financials are based on the most recent Mortgage that was taken out on this home.
Original Mortgage
$313,222
Outstanding Balance
$207,788
Interest Rate
4.92%
Mortgage Type
FHA
Estimated Equity
$588,613
Purchase Details
Closed on
Dec 21, 2009
Sold by
Gutierrez Salvador and Gutierrez Blanca
Bought by
Pgi Investments Llc
Purchase Details
Closed on
Jun 9, 2005
Sold by
Wilcox Arthur L and Wilcox Paulina T
Bought by
Gutierrez Salvador and Gutierrez Blanca
Home Financials for this Owner
Home Financials are based on the most recent Mortgage that was taken out on this home.
Original Mortgage
$392,000
Interest Rate
5.75%
Mortgage Type
Unknown
Purchase Details
Closed on
Apr 23, 1985
Create a Home Valuation Report for This Property
The Home Valuation Report is an in-depth analysis detailing your home's value as well as a comparison with similar homes in the area
Home Values in the Area
Average Home Value in this Area
Purchase History
| Date | Buyer | Sale Price | Title Company |
|---|---|---|---|
| Alvarez Valente | $319,000 | Ticor Title Redlands | |
| Pgi Investments Llc | $240,000 | Ticor Title | |
| Gutierrez Salvador | $490,000 | California Title Company | |
| -- | $94,000 | -- |
Source: Public Records
Mortgage History
| Date | Status | Borrower | Loan Amount |
|---|---|---|---|
| Open | Alvarez Valente | $313,222 | |
| Previous Owner | Gutierrez Salvador | $392,000 |
Source: Public Records
Tax History
| Year | Tax Paid | Tax Assessment Tax Assessment Total Assessment is a certain percentage of the fair market value that is determined by local assessors to be the total taxable value of land and additions on the property. | Land | Improvement |
|---|---|---|---|---|
| 2025 | $4,487 | $411,754 | $260,058 | $151,696 |
| 2024 | $4,487 | $403,681 | $254,959 | $148,722 |
| 2023 | $4,347 | $395,766 | $249,960 | $145,806 |
| 2022 | $4,280 | $388,007 | $245,059 | $142,948 |
| 2021 | $4,295 | $380,400 | $240,254 | $140,146 |
| 2020 | $4,162 | $376,500 | $237,791 | $138,709 |
| 2019 | $4,040 | $369,119 | $233,129 | $135,990 |
| 2018 | $3,996 | $361,882 | $228,558 | $133,324 |
| 2017 | $3,921 | $354,787 | $224,077 | $130,710 |
| 2016 | $3,793 | $347,832 | $219,684 | $128,148 |
| 2015 | $3,682 | $342,609 | $216,385 | $126,224 |
| 2014 | $3,529 | $335,000 | $212,000 | $123,000 |
Source: Public Records
Map
Nearby Homes
- 4786 Macadamia Ct
- 4791 Macadamia Ct
- 255 Flame Tree Place
- 185 Harrison St
- 154 Harrison St
- 4798 Calle Los Santos
- 4918 Roja Dr
- 4781 Calle Las Positas
- 4750 Calle Estrella
- 5063 Waterview Way
- 5065 Waterview Way
- 5108 Andrew Jackson St
- 4950 Luna Dr
- 4924 Verde Dr
- 5033 Los Morros Way Unit 55
- 436 W Redondo Dr
- 761 Masters Dr
- 150 N River Cir Unit 105
- 4877 Merida Way
- 4885 Merida Way
- 4847 Gardenia St
- 4850 Ceanothus Place Unit 6
- 4855 Gardenia St
- 4843 Gardenia St Unit 3
- 4846 Ceanothus Place
- 4842 Ceanothus Place
- 4839 Gardenia St
- 210 Manzanita Dr
- 214 Manzanita Dr
- 4838 Ceanothus Place
- 4835 Gardenia St
- 218 Manzanita Dr
- 4863 Gardenia St
- 4845 Ceanothus Place
- 4834 Ceanothus Place
- 4841 Ceanothus Place
- 4831 Gardenia St
- 222 Manzanita Dr
- 4837 Ceanothus Place
- 213 Saguaro Place
Your Personal Tour Guide
Ask me questions while you tour the home.