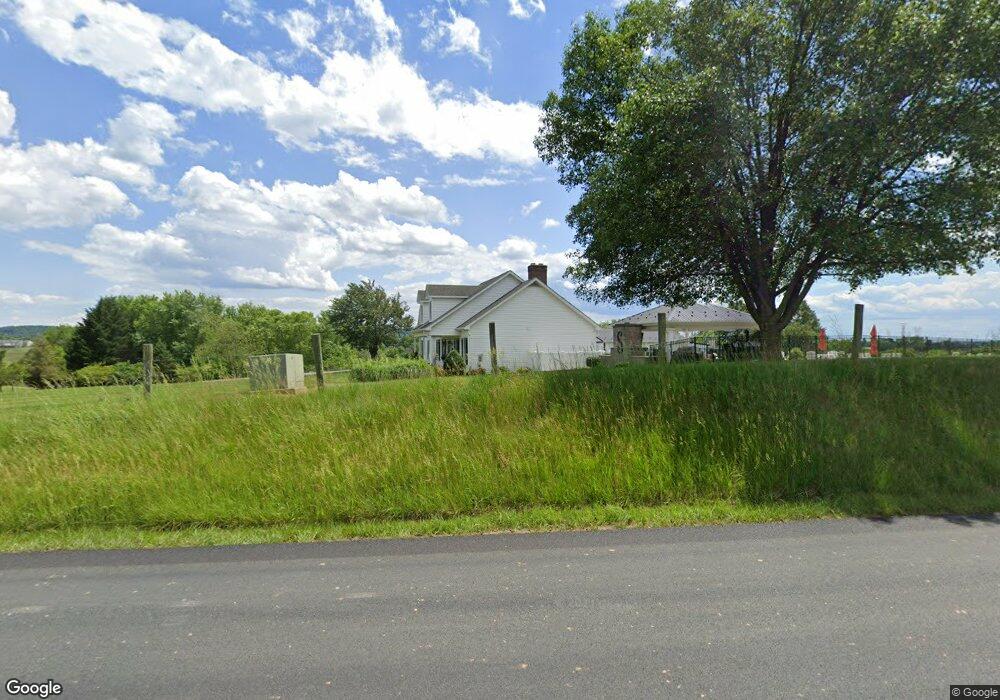
4852 Broad Run Rd Jefferson, MD 21755
Estimated Value: $611,000 - $637,800
--
Bed
3
Baths
2,102
Sq Ft
$296/Sq Ft
Est. Value
About This Home
This home is located at 4852 Broad Run Rd, Jefferson, MD 21755 and is currently estimated at $621,700, approximately $295 per square foot. 4852 Broad Run Rd is a home located in Frederick County with nearby schools including Valley Elementary School, Brunswick Middle School, and Brunswick High School.
Ownership History
Date
Name
Owned For
Owner Type
Purchase Details
Closed on
Feb 5, 2007
Sold by
Shoup Richard G and Shoup Pamela K
Bought by
Stauffer Ii George D and Stauffer Courtney M
Current Estimated Value
Home Financials for this Owner
Home Financials are based on the most recent Mortgage that was taken out on this home.
Original Mortgage
$391,200
Outstanding Balance
$235,352
Interest Rate
6.24%
Mortgage Type
Purchase Money Mortgage
Estimated Equity
$386,348
Purchase Details
Closed on
Jan 31, 2007
Sold by
Shoup Richard G and Shoup Pamela K
Bought by
Stauffer Ii George D and Stauffer Courtney M
Home Financials for this Owner
Home Financials are based on the most recent Mortgage that was taken out on this home.
Original Mortgage
$391,200
Outstanding Balance
$235,352
Interest Rate
6.24%
Mortgage Type
Purchase Money Mortgage
Estimated Equity
$386,348
Purchase Details
Closed on
Oct 13, 1998
Sold by
Shaff Wayne V
Bought by
Shoup Richard G and Shoup Pamela K
Create a Home Valuation Report for This Property
The Home Valuation Report is an in-depth analysis detailing your home's value as well as a comparison with similar homes in the area
Home Values in the Area
Average Home Value in this Area
Purchase History
| Date | Buyer | Sale Price | Title Company |
|---|---|---|---|
| Stauffer Ii George D | $489,000 | -- | |
| Stauffer Ii George D | $489,000 | -- | |
| Shoup Richard G | $75,000 | -- |
Source: Public Records
Mortgage History
| Date | Status | Borrower | Loan Amount |
|---|---|---|---|
| Open | Stauffer Ii George D | $391,200 | |
| Closed | Stauffer Ii George D | $391,200 | |
| Closed | Shoup Richard G | -- |
Source: Public Records
Tax History Compared to Growth
Tax History
| Year | Tax Paid | Tax Assessment Tax Assessment Total Assessment is a certain percentage of the fair market value that is determined by local assessors to be the total taxable value of land and additions on the property. | Land | Improvement |
|---|---|---|---|---|
| 2025 | $5,894 | $507,167 | -- | -- |
| 2024 | $5,894 | $474,500 | $132,900 | $341,600 |
| 2023 | $5,326 | $441,833 | $0 | $0 |
| 2022 | $4,900 | $409,167 | $0 | $0 |
| 2021 | $4,417 | $376,500 | $103,500 | $273,000 |
| 2020 | $4,417 | $367,567 | $0 | $0 |
| 2019 | $4,313 | $358,633 | $0 | $0 |
| 2018 | $4,246 | $349,700 | $103,500 | $246,200 |
| 2017 | $3,970 | $349,700 | $0 | $0 |
| 2016 | $4,170 | $308,500 | $0 | $0 |
| 2015 | $4,170 | $287,900 | $0 | $0 |
| 2014 | $4,170 | $287,900 | $0 | $0 |
Source: Public Records
Map
Nearby Homes
- 3343 Brockton Dr
- 3412 Jefferson Pike
- 3419 Jefferson Pike
- 4695 Puller Dr
- 3707 Cool Crest Dr
- 3801 Brook Dr
- 3805 Bedford Dr
- 5109 Ella Ct
- 2640 Jefferson Pike
- 3855 Shadywood Dr Unit 2D
- 3856 Shadywood Dr Unit 3D
- 3856 Shadywood Dr Unit 2B
- 3830 Jefferson Pike
- 4144A Lander Rd
- 4144 Lander Road Lander Rd
- 4810 Camden Place S
- 4147 Lander Rd
- 4805 Bennington Place E
- Lot 1 Sumantown Rd
- Lot 2 Sumantown Rd
- 4844 Broad Run Rd
- 4836 Broad Run Rd
- 4863 Broad Run Rd
- 4847 Broad Run Rd
- 4812 Broad Run Rd
- 4752 Broad St
- 4903 Broad Run Rd
- 4752 Broad Run Rd
- 4802 Broad Run Rd
- 4855 Broad Run Rd
- 4950 Corun Rd
- 4949 Corun Rd
- 4664 Newington Rd
- 4746 Broad Run Rd
- 4666 Newington Rd
- 4662 Newington Rd
- 4660 Newington Rd
- 4656 Newington Rd
- 4668 Newington Rd
- 4742 Broad Run Rd