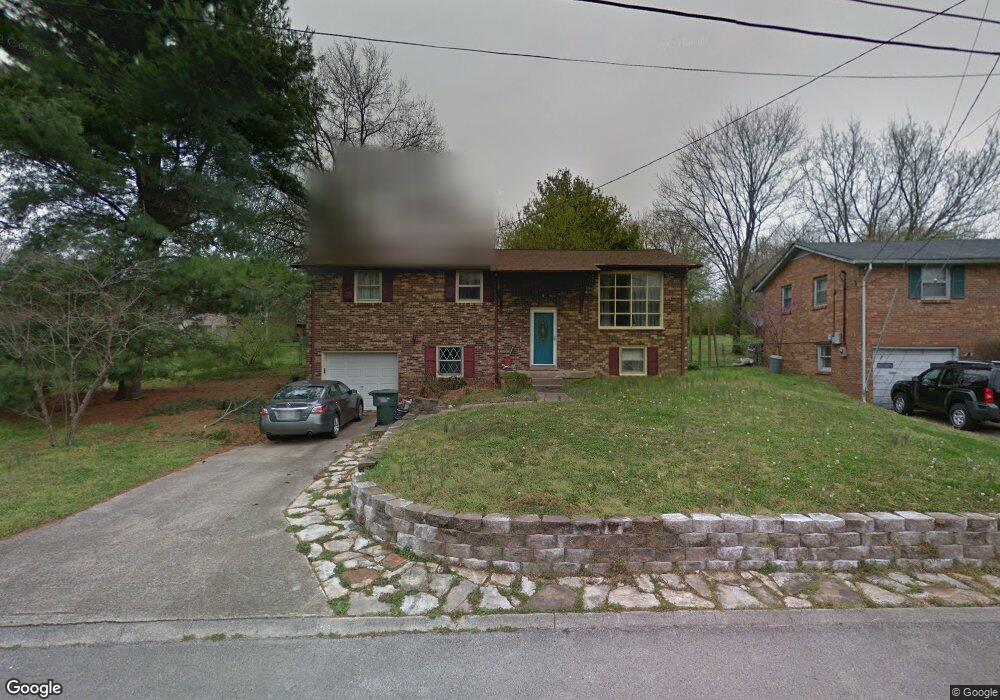
4852 Catskill Dr Old Hickory, TN 37138
Estimated Value: $347,000 - $447,000
Studio
2
Baths
2,000
Sq Ft
$192/Sq Ft
Est. Value
About This Home
This home is located at 4852 Catskill Dr, Old Hickory, TN 37138 and is currently estimated at $383,143, approximately $191 per square foot. 4852 Catskill Dr is a home located in Wilson County with nearby schools including W.A. Wright Elementary School, Mt. Juliet Middle School, and Green Hill High School.
Ownership History
Date
Name
Owned For
Owner Type
Purchase Details
Closed on
Jul 25, 2006
Sold by
Moravec Steven W
Bought by
Wamsley Rosalind J
Current Estimated Value
Home Financials for this Owner
Home Financials are based on the most recent Mortgage that was taken out on this home.
Original Mortgage
$117,600
Outstanding Balance
$68,822
Interest Rate
6.68%
Estimated Equity
$314,321
Purchase Details
Closed on
Jul 19, 2006
Sold by
Moravec Steven W
Bought by
Wamsley Rosalind J
Home Financials for this Owner
Home Financials are based on the most recent Mortgage that was taken out on this home.
Original Mortgage
$117,600
Outstanding Balance
$68,822
Interest Rate
6.68%
Estimated Equity
$314,321
Purchase Details
Closed on
Jul 31, 1995
Bought by
Moravec Steven W
Purchase Details
Closed on
May 8, 1995
Bought by
Shook Randy B
Purchase Details
Closed on
Sep 4, 1982
Bought by
Melchiorre James
Purchase Details
Closed on
Oct 16, 1978
Create a Home Valuation Report for This Property
The Home Valuation Report is an in-depth analysis detailing your home's value as well as a comparison with similar homes in the area
Home Values in the Area
Average Home Value in this Area
Purchase History
| Date | Buyer | Sale Price | Title Company |
|---|---|---|---|
| Wamsley Rosalind J | $147,000 | -- | |
| Wamsley Rosalind J | $147,000 | -- | |
| Moravec Steven W | $96,000 | -- | |
| Shook Randy B | $75,000 | -- | |
| Melchiorre James | -- | -- | |
| -- | -- | -- |
Source: Public Records
Mortgage History
| Date | Status | Borrower | Loan Amount |
|---|---|---|---|
| Open | Not Available | $117,600 | |
| Closed | Not Available | $14,700 | |
| Closed | Not Available | $117,600 |
Source: Public Records
Tax History
| Year | Tax Paid | Tax Assessment Tax Assessment Total Assessment is a certain percentage of the fair market value that is determined by local assessors to be the total taxable value of land and additions on the property. | Land | Improvement |
|---|---|---|---|---|
| 2025 | $1,109 | $58,100 | $13,750 | $44,350 |
| 2024 | $1,109 | $58,100 | $13,750 | $44,350 |
| 2022 | $1,109 | $58,100 | $13,750 | $44,350 |
| 2021 | $1,109 | $58,100 | $13,750 | $44,350 |
| 2020 | $947 | $58,100 | $13,750 | $44,350 |
| 2019 | $947 | $37,600 | $8,925 | $28,675 |
| 2018 | $947 | $37,600 | $8,925 | $28,675 |
| 2017 | $947 | $37,600 | $8,925 | $28,675 |
| 2016 | $947 | $37,600 | $8,925 | $28,675 |
| 2015 | $966 | $37,600 | $8,925 | $28,675 |
| 2014 | $859 | $33,435 | $0 | $0 |
Source: Public Records
Map
Nearby Homes
- 4741 Cascade Dr
- 4833 Rainer Dr
- 3001 Remington Park Ln
- 4855 Shoshone Dr
- 310 Santa Rosa Dr
- 4610 Woodside Dr
- 4614 Woodside Dr
- 2405 Pleasant Springs Ln
- 904 Old Fountain Place
- 816 Old Coach Place
- 722 Blue Brick Place Unit 722
- 545 Springmont Blvd
- 1869 Brookmeadow Ln
- 624 Weatherbeaten Place Unit 624
- 2317 Crescent Valley Place
- 604 Weatherbeaten Place Unit 604
- 4803 Wayside Dr
- 208 Tyne Blvd
- 220 Harpers Mill Ct Unit 220
- 230 Harpers Mill Ct
- 4848 Catskill Dr
- 4856 Catskill Dr
- 4813 Sierra Dr
- 4809 Sierra Dr
- 4805 Sierra Dr
- 4860 Catskill Dr
- 4844 Catskill Dr
- 4817 Sierra Dr
- 4857 Catskill Dr
- 4844 Matterhorn Dr
- 4849 Catskill Dr
- 4861 Catskill Dr
- 4821 Sierra Dr
- 4853 Catskill Dr
- 4848 Matterhorn Dr
- 4845 Catskill Dr
- 4816 Sierra Dr
- 4852 Matterhorn Dr
- 4825 Sierra Dr
- 4832 Matterhorn Dr
Your Personal Tour Guide
Ask me questions while you tour the home.