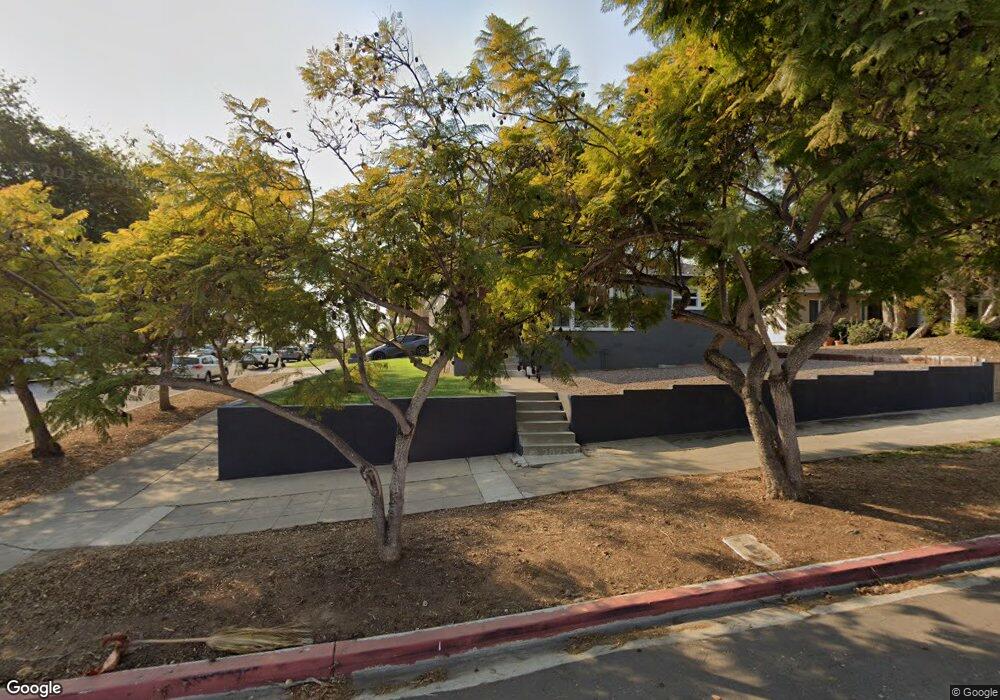
4852 Lamont St San Diego, CA 92109
Pacific Beach NeighborhoodEstimated Value: $1,561,441 - $1,944,000
3
Beds
2
Baths
1,233
Sq Ft
$1,432/Sq Ft
Est. Value
About This Home
This home is located at 4852 Lamont St, San Diego, CA 92109 and is currently estimated at $1,765,610, approximately $1,431 per square foot. 4852 Lamont St is a home located in San Diego County with nearby schools including Sessions Elementary School, Pacific Beach Middle, and Mission Bay High School.
Ownership History
Date
Name
Owned For
Owner Type
Purchase Details
Closed on
Jul 28, 2014
Sold by
Ables Thomas K and Ables Deborah L
Bought by
Monahan Ian and Herman Talia
Current Estimated Value
Home Financials for this Owner
Home Financials are based on the most recent Mortgage that was taken out on this home.
Original Mortgage
$559,910
Outstanding Balance
$427,090
Interest Rate
4.12%
Mortgage Type
New Conventional
Estimated Equity
$1,338,520
Purchase Details
Closed on
Oct 24, 2013
Sold by
Ables Deborah L
Bought by
Ables Thomas K and Ables Deborah L
Home Financials for this Owner
Home Financials are based on the most recent Mortgage that was taken out on this home.
Original Mortgage
$588,000
Interest Rate
3.25%
Mortgage Type
New Conventional
Purchase Details
Closed on
Apr 15, 2013
Sold by
Ables Deborah L and Lemley Rodney Robert
Bought by
Lemley Rodney Robert
Purchase Details
Closed on
Apr 19, 2007
Sold by
Ables Thomas K and Ables Deborah Lemley
Bought by
Ables Thomas K and Ables Deborah L
Purchase Details
Closed on
Dec 21, 2000
Sold by
Lemley Mary K
Bought by
Lemley Mary K
Create a Home Valuation Report for This Property
The Home Valuation Report is an in-depth analysis detailing your home's value as well as a comparison with similar homes in the area
Home Values in the Area
Average Home Value in this Area
Purchase History
| Date | Buyer | Sale Price | Title Company |
|---|---|---|---|
| Monahan Ian | $700,000 | Ticor Title | |
| Ables Thomas K | -- | Lawyers Title | |
| Lemley Rodney Robert | -- | None Available | |
| Ables Thomas K | -- | None Available | |
| Lemley Mary K | -- | -- |
Source: Public Records
Mortgage History
| Date | Status | Borrower | Loan Amount |
|---|---|---|---|
| Open | Monahan Ian | $559,910 | |
| Previous Owner | Ables Thomas K | $588,000 |
Source: Public Records
Tax History Compared to Growth
Tax History
| Year | Tax Paid | Tax Assessment Tax Assessment Total Assessment is a certain percentage of the fair market value that is determined by local assessors to be the total taxable value of land and additions on the property. | Land | Improvement |
|---|---|---|---|---|
| 2025 | $10,076 | $841,150 | $745,142 | $96,008 |
| 2024 | $10,076 | $824,658 | $730,532 | $94,126 |
| 2023 | $9,853 | $808,489 | $716,208 | $92,281 |
| 2022 | $9,589 | $792,637 | $702,165 | $90,472 |
| 2021 | $9,522 | $777,097 | $688,398 | $88,699 |
| 2020 | $9,406 | $769,130 | $681,340 | $87,790 |
| 2019 | $9,236 | $754,050 | $667,981 | $86,069 |
| 2018 | $8,634 | $739,266 | $654,884 | $84,382 |
| 2017 | $80 | $724,772 | $642,044 | $82,728 |
| 2016 | $8,292 | $710,561 | $629,455 | $81,106 |
| 2015 | $8,168 | $699,888 | $620,000 | $79,888 |
| 2014 | $1,458 | $128,105 | $66,703 | $61,402 |
Source: Public Records
Map
Nearby Homes
- 4804 Lamont St
- 1978 Beryl St
- 1981 Wilbur Ave
- 1897 Malden St
- 4964 Kendall St
- 2002 Missouri St Unit 6
- 1828 Diamond St Unit 3
- 1715 Malden St
- 1713 Missouri St
- 1679-81 Chalcedony St
- 2020 Diamond St Unit 12
- 4750 Noyes St Unit 110
- 4600 Lamont St Unit 4-103
- 4730 Noyes St Unit 106
- 1885 Diamond St Unit 133
- 1885 Diamond St Unit 2-235
- 1885 Diamond St Unit 2-234
- 1885 Diamond St Unit 310
- 1855 Diamond St Unit 201
- 1775 Diamond St Unit 220