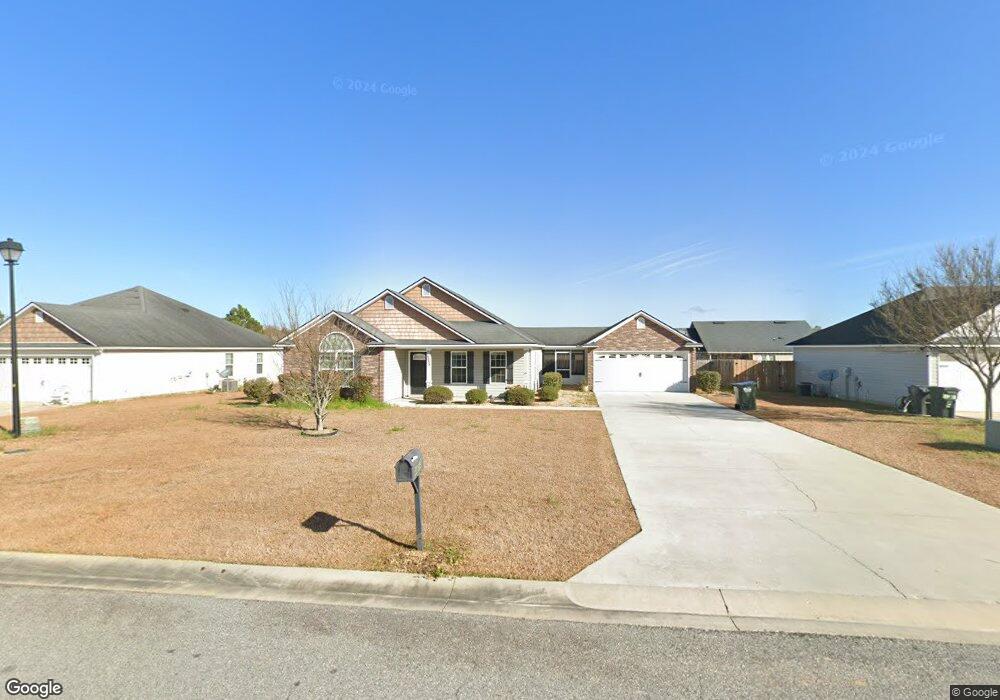
4853 Stonewall Cir Valdosta, GA 31605
Estimated Value: $229,000 - $296,000
3
Beds
2
Baths
1,450
Sq Ft
$172/Sq Ft
Est. Value
About This Home
This home is located at 4853 Stonewall Cir, Valdosta, GA 31605 and is currently estimated at $248,888, approximately $171 per square foot. 4853 Stonewall Cir is a home located in Lowndes County with nearby schools including Pine Grove Elementary School, Pine Grove Middle School, and Lowndes High School.
Ownership History
Date
Name
Owned For
Owner Type
Purchase Details
Closed on
Jan 14, 2022
Sold by
Miller James P
Bought by
Collier Julie Terese and Collier Paul Lewis
Current Estimated Value
Home Financials for this Owner
Home Financials are based on the most recent Mortgage that was taken out on this home.
Original Mortgage
$160,000
Outstanding Balance
$147,671
Interest Rate
3.22%
Mortgage Type
Cash
Estimated Equity
$101,217
Purchase Details
Closed on
May 1, 2012
Sold by
Lowndes Investments Llc
Bought by
Miller James P
Home Financials for this Owner
Home Financials are based on the most recent Mortgage that was taken out on this home.
Original Mortgage
$142,907
Interest Rate
4.01%
Mortgage Type
VA
Purchase Details
Closed on
Jun 26, 2008
Sold by
Lowndes Development Llc
Bought by
Lowndes Investments Llc
Purchase Details
Closed on
Feb 2, 2007
Bought by
Lowndes Development Llc
Create a Home Valuation Report for This Property
The Home Valuation Report is an in-depth analysis detailing your home's value as well as a comparison with similar homes in the area
Home Values in the Area
Average Home Value in this Area
Purchase History
| Date | Buyer | Sale Price | Title Company |
|---|---|---|---|
| Collier Julie Terese | $190,000 | -- | |
| Miller James P | $139,900 | -- | |
| Lowndes Investments Llc | -- | -- | |
| Lowndes Development Llc | -- | -- |
Source: Public Records
Mortgage History
| Date | Status | Borrower | Loan Amount |
|---|---|---|---|
| Open | Collier Julie Terese | $160,000 | |
| Previous Owner | Miller James P | $142,907 |
Source: Public Records
Tax History Compared to Growth
Tax History
| Year | Tax Paid | Tax Assessment Tax Assessment Total Assessment is a certain percentage of the fair market value that is determined by local assessors to be the total taxable value of land and additions on the property. | Land | Improvement |
|---|---|---|---|---|
| 2024 | $2,175 | $88,589 | $14,400 | $74,189 |
| 2023 | $2,175 | $83,643 | $14,400 | $69,243 |
| 2022 | $1,934 | $67,162 | $14,400 | $52,762 |
| 2021 | $1,607 | $53,092 | $14,400 | $38,692 |
| 2020 | $1,497 | $53,092 | $14,400 | $38,692 |
| 2019 | $1,512 | $53,092 | $14,400 | $38,692 |
| 2018 | $1,527 | $53,092 | $14,400 | $38,692 |
| 2017 | $1,574 | $54,170 | $14,400 | $39,770 |
| 2016 | $1,578 | $54,170 | $14,400 | $39,770 |
| 2015 | $1,524 | $54,572 | $14,400 | $40,172 |
| 2014 | $1,555 | $54,572 | $14,400 | $40,172 |
Source: Public Records
Map
Nearby Homes
- 4896 Stonewall Cir
- 0 Vienna Church Rd
- 4640 Daniel Hester Rd
- 5210 Northridge Rd N
- 4941 Oak Hill Dr
- 4723 Mcallister St
- 5137 Mellow Dr
- 4581 & 4495 Bemiss Rd
- 4014 Sandy Run Dr
- 3955 Cobblestone Way
- 6038 Bemiss Towns Dr
- 4223 Conway Cir
- 3705 Cross Creek Cir
- 6161 Bemiss Springs Dr
- 3904 Countess Ct
- 6169 Bemiss Springs Dr
- 6177 Bemiss Springs Dr
- 6185 Bemiss Springs Dr
- 6189 Bemiss Springs Dr
- 4017 Old Pine Rd
- 4847 Stonewall Cir
- 4859 Stonewall Cir
- 4909 Grant Dr
- 4903 Grant Dr
- 4915 Grant Dr
- 4841 Stonewall Cir
- 4865 Stonewall Cir
- 4854 Stonewall Cir
- 4848 Stonewall Cir
- 4897 Grant Dr
- 4860 Stonewall Cir
- 4921 Grant Dr
- 4842 Stonewall Cir
- 4835 Stonewall Cir
- 4836 Stonewall Cir
- 4927 Grant Dr
- 4864 Stonewall Cir
- 4910 Grant Dr
- 4904 Grant Dr
- 4916 Grant Dr