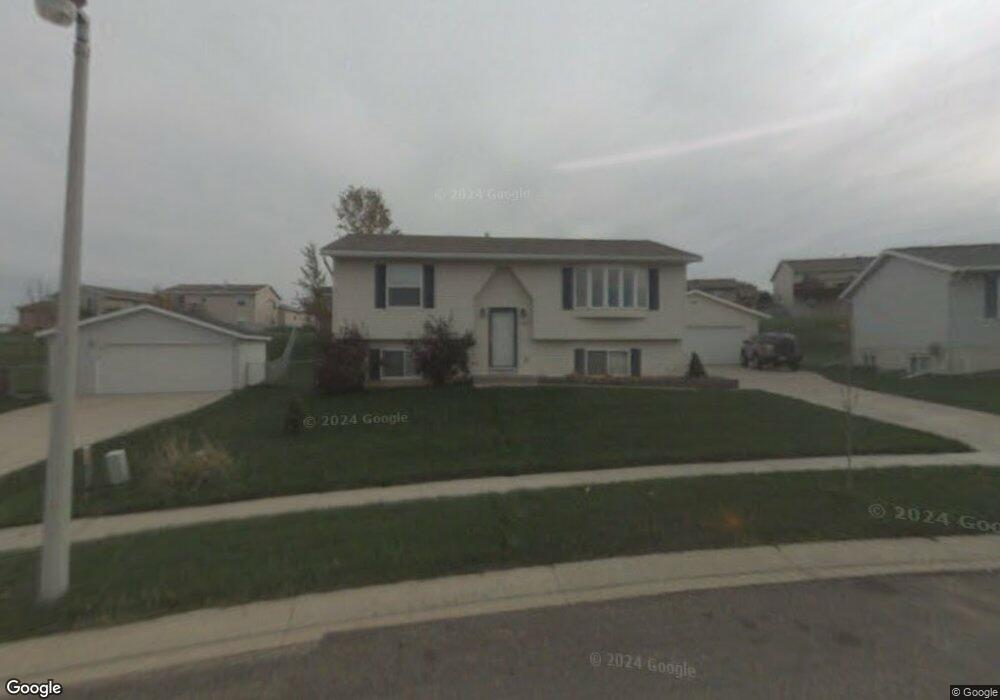
4854 Opal Ln NW Rochester, MN 55901
The Manor NeighborhoodEstimated Value: $308,000 - $340,000
3
Beds
2
Baths
1,932
Sq Ft
$168/Sq Ft
Est. Value
About This Home
This home is located at 4854 Opal Ln NW, Rochester, MN 55901 and is currently estimated at $323,702, approximately $167 per square foot. 4854 Opal Ln NW is a home located in Olmsted County with nearby schools including Bishop Elementary School, John Adams Middle School, and John Marshall Senior High School.
Ownership History
Date
Name
Owned For
Owner Type
Purchase Details
Closed on
Jul 9, 2020
Sold by
Wong Andrew and Wong Alyssa
Bought by
Pender Stetson R
Current Estimated Value
Home Financials for this Owner
Home Financials are based on the most recent Mortgage that was taken out on this home.
Original Mortgage
$205,650
Outstanding Balance
$182,357
Interest Rate
3.1%
Mortgage Type
New Conventional
Estimated Equity
$141,345
Purchase Details
Closed on
Sep 14, 2011
Sold by
Secretary Of Housing & Urban Development
Bought by
Wong Andrew
Purchase Details
Closed on
Sep 1, 2010
Sold by
Wells Fargo Bank Na
Bought by
Secretary Of Housing & Urban Development
Purchase Details
Closed on
May 28, 2010
Sold by
Bittner Megan M and Batty Blake T
Bought by
Wells Fargo Bank Nz
Create a Home Valuation Report for This Property
The Home Valuation Report is an in-depth analysis detailing your home's value as well as a comparison with similar homes in the area
Home Values in the Area
Average Home Value in this Area
Purchase History
| Date | Buyer | Sale Price | Title Company |
|---|---|---|---|
| Pender Stetson R | $228,500 | Rochester Title & Escrow Co | |
| Wong Andrew | -- | Northwest Title Agency Inc | |
| Secretary Of Housing & Urban Development | -- | None Available | |
| Wells Fargo Bank Nz | $165,641 | None Available |
Source: Public Records
Mortgage History
| Date | Status | Borrower | Loan Amount |
|---|---|---|---|
| Open | Pender Stetson R | $205,650 |
Source: Public Records
Tax History Compared to Growth
Tax History
| Year | Tax Paid | Tax Assessment Tax Assessment Total Assessment is a certain percentage of the fair market value that is determined by local assessors to be the total taxable value of land and additions on the property. | Land | Improvement |
|---|---|---|---|---|
| 2024 | $3,738 | $284,400 | $50,000 | $234,400 |
| 2023 | $3,224 | $267,400 | $50,000 | $217,400 |
| 2022 | $2,782 | $255,600 | $50,000 | $205,600 |
| 2021 | $2,688 | $217,500 | $40,000 | $177,500 |
| 2020 | $2,728 | $210,700 | $40,000 | $170,700 |
| 2019 | $2,560 | $206,000 | $40,000 | $166,000 |
| 2018 | $2,172 | $195,800 | $40,000 | $155,800 |
| 2017 | $2,082 | $175,400 | $25,000 | $150,400 |
| 2016 | $1,938 | $139,000 | $21,500 | $117,500 |
| 2015 | $1,830 | $126,500 | $21,100 | $105,400 |
| 2014 | $1,760 | $128,000 | $21,100 | $106,900 |
| 2012 | -- | $126,000 | $21,028 | $104,972 |
Source: Public Records
Map
Nearby Homes
- 4541 Ruby Ln NW
- 828 Diamond Ridge Ln NW
- 3740 8th St NW
- 3938 7th St NW
- 4339 Manor Park Dr NW
- 255x Heartland Dr NW
- 4992 4th St NW
- 4822 3rd St NW
- 660 36th Ave NW
- 650 36th Ave NW
- 4444 3rd St NW
- 3555 6th St NW
- 3586 6th St NW
- 4036 3rd St NW
- 2535 Superior Ln NW
- 3415 7th St NW
- 468 Panorama Cir NW
- 2925 Monroe Dr NW
- 700 Panorama Cir NW
- 3415 Lake St NW
- 4858 Opal Ln NW
- 4848 Opal Ln NW
- 4821 Valley Dr NW
- 4827 Valley Dr NW
- 4862 Opal Ln NW
- 4815 Valley Dr NW
- 4849 Opal Ln NW
- 4833 Valley Dr NW
- 4842 Opal Ln NW
- 4809 Valley Dr NW
- 4866 Opal Ln NW
- 4837 Valley Dr NW
- 4863 Opal Ln NW
- 4837 Opal Ln NW
- 4836 Opal Ln NW
- 909 48th Ave NW
- 4803 Valley Dr NW
- 4867 Opal Ln NW
- 4843 Valley Dr NW
- 4870 Opal Ln NW