Estimated Value: $1,102,000 - $1,183,428
3
Beds
3
Baths
2,315
Sq Ft
$492/Sq Ft
Est. Value
About This Home
This home is located at 4855 Jackrabbit Rd Unit NV, Reno, NV 89510 and is currently estimated at $1,139,357, approximately $492 per square foot. 4855 Jackrabbit Rd Unit NV is a home located in Washoe County with nearby schools including Alyce Savage Taylor Elementary School, Yvonne Shaw Middle School, and Spanish Springs High School.
Ownership History
Date
Name
Owned For
Owner Type
Purchase Details
Closed on
Jan 26, 2022
Sold by
Johnson Forrest D and Johnson Judith A
Bought by
Mannens Matthew
Current Estimated Value
Home Financials for this Owner
Home Financials are based on the most recent Mortgage that was taken out on this home.
Original Mortgage
$790,000
Outstanding Balance
$726,184
Interest Rate
3.22%
Mortgage Type
New Conventional
Estimated Equity
$413,173
Purchase Details
Closed on
Feb 9, 1995
Sold by
Mestemaker Michael J and Mestemaker Karen J
Bought by
Johnson Forrest D and Johnson Judith A
Purchase Details
Closed on
Jun 22, 1994
Sold by
Founders Title Company Of Nevada
Bought by
Mestemaker Michael J and Mestemaker Karen J
Create a Home Valuation Report for This Property
The Home Valuation Report is an in-depth analysis detailing your home's value as well as a comparison with similar homes in the area
Purchase History
| Date | Buyer | Sale Price | Title Company |
|---|---|---|---|
| Mannens Matthew | $1,165,000 | First Centennial Title | |
| Johnson Forrest D | $33,500 | First Centennial Title Co | |
| Mestemaker Michael J | $19,000 | Founders Title Company |
Source: Public Records
Mortgage History
| Date | Status | Borrower | Loan Amount |
|---|---|---|---|
| Open | Mannens Matthew | $790,000 |
Source: Public Records
Tax History
| Year | Tax Paid | Tax Assessment Tax Assessment Total Assessment is a certain percentage of the fair market value that is determined by local assessors to be the total taxable value of land and additions on the property. | Land | Improvement |
|---|---|---|---|---|
| 2026 | $2,741 | $138,495 | $59,500 | $78,995 |
| 2024 | $3,548 | $125,656 | $43,750 | $81,906 |
| 2023 | $3,445 | $116,316 | $38,745 | $77,571 |
| 2022 | $3,345 | $96,023 | $31,500 | $64,523 |
| 2021 | $3,247 | $94,234 | $29,750 | $64,484 |
| 2020 | $3,153 | $89,315 | $24,500 | $64,815 |
| 2019 | $3,061 | $84,193 | $21,000 | $63,193 |
| 2018 | $2,972 | $83,066 | $21,000 | $62,066 |
| 2017 | $2,885 | $78,826 | $16,450 | $62,376 |
| 2016 | $2,923 | $79,863 | $16,450 | $63,413 |
| 2015 | $2,939 | $80,289 | $16,450 | $63,839 |
| 2014 | $2,861 | $78,171 | $16,450 | $61,721 |
| 2013 | -- | $77,290 | $16,450 | $60,840 |
Source: Public Records
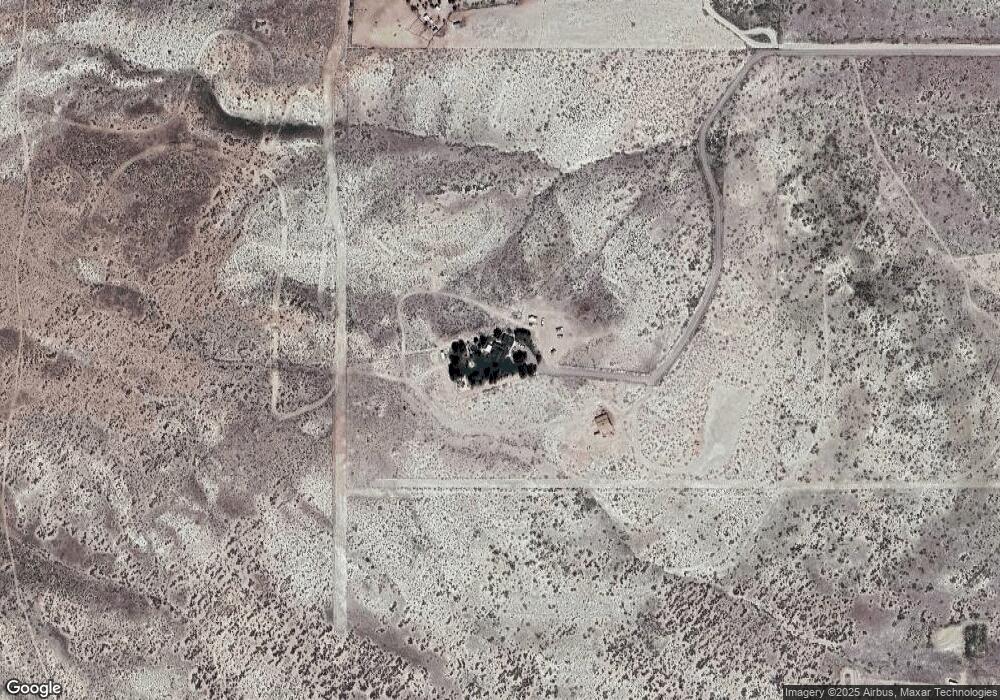
Map
Nearby Homes
- 5025 Jackrabbit Rd
- 6000 Winnemucca Ranch Rd
- 0 Pyramid (076-261-04) Way Unit 250053900
- 5500 Peak Rd
- 4055 Bacon Rind Rd
- 0 Rebel Cause Rd Unit 250057501
- 0000 Ironwood Rd
- 5555 Sage Flat Rd
- 1220 Mineral Flat Rd
- 5075 Axe Handle Canyon Rd
- 605 Ironwood Rd
- 0 Youngs Rd
- 0 Ironwood Rd Unit 260000367
- 5555 Aerie Way
- 6155 Sage Flat Rd
- 12445 Ocean View Dr
- 275 Descanso Ln
- 5550 Flying Eagle Dr
- 155 Pinto Ranch Ct
- 295 Descanso Ln
- 4855 Jackrabbit Rd
- 4955 Jackrabbit Rd
- 4825 Jackrabbit Rd
- 4905 Jackrabbit Rd
- 4555 Jackrabbit Rd
- 4800 Jackrabbit Rd
- 855 Prairie Rd
- 4700 Jackrabbit Rd
- 5055 Jackrabbit Rd
- 5000 Jackrabbit Rd
- 4955 Big Dog Rd
- 4555 Big Dog Rd
- 5155 Jackrabbit Rd
- 6100 Prairie Rd
- 000 Jackrabbit
- 5100 Jackrabbit Rd
- 5100 Jackrabbit Rd
- 4805 Big Dog Rd
Your Personal Tour Guide
Ask me questions while you tour the home.