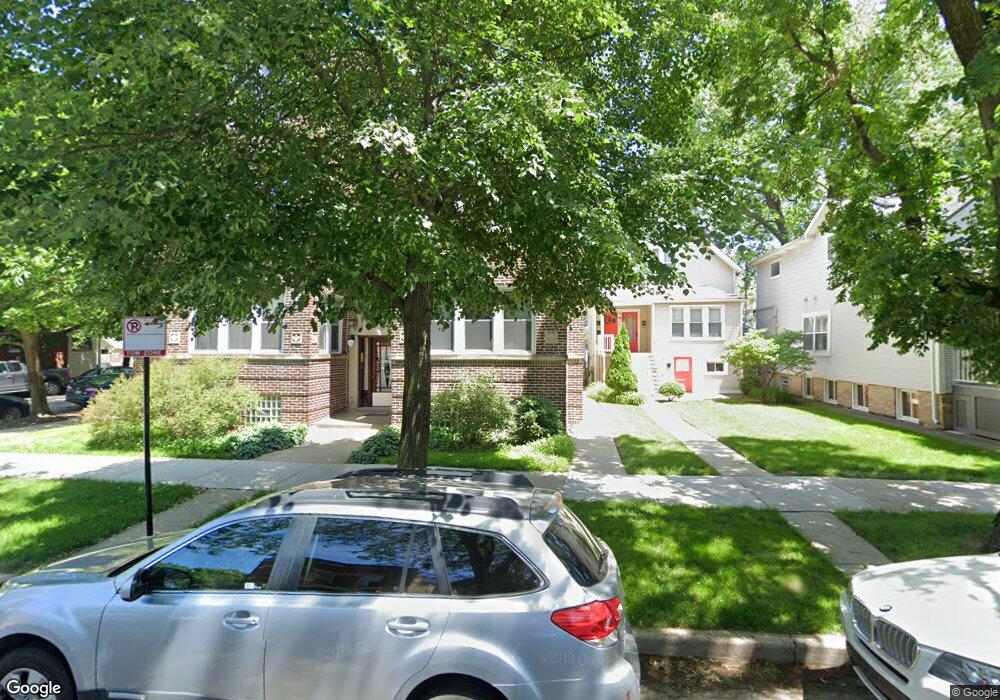
4855 N Hoyne Ave Unit 48552 Chicago, IL 60625
Ravenswood NeighborhoodEstimated Value: $287,000 - $342,000
--
Bed
--
Bath
17,656
Sq Ft
$18/Sq Ft
Est. Value
About This Home
This home is located at 4855 N Hoyne Ave Unit 48552, Chicago, IL 60625 and is currently estimated at $312,364, approximately $17 per square foot. 4855 N Hoyne Ave Unit 48552 is a home located in Cook County with nearby schools including McPherson Elementary School, Amundsen High School, and Lycee Francais de Chicago.
Ownership History
Date
Name
Owned For
Owner Type
Purchase Details
Closed on
Jun 29, 2021
Sold by
Bain Jacob and Bain Rachel Elizabeth
Bought by
Gylling Jason
Current Estimated Value
Home Financials for this Owner
Home Financials are based on the most recent Mortgage that was taken out on this home.
Original Mortgage
$192,000
Interest Rate
2.8%
Mortgage Type
New Conventional
Purchase Details
Closed on
Jun 3, 2016
Sold by
Ideal House Llc
Bought by
Bain Jacob
Purchase Details
Closed on
Feb 5, 2016
Sold by
Georgeoglou Athina Troupkos and Georgeoglou Dennis
Bought by
Ideal House Llc Series 4855 Hoyne Ave
Purchase Details
Closed on
Aug 22, 2001
Sold by
Chernoff Leonard
Bought by
North Star Trust Company and Trust #01-3778
Create a Home Valuation Report for This Property
The Home Valuation Report is an in-depth analysis detailing your home's value as well as a comparison with similar homes in the area
Home Values in the Area
Average Home Value in this Area
Purchase History
| Date | Buyer | Sale Price | Title Company |
|---|---|---|---|
| Gylling Jason | $240,000 | Chicago Title | |
| Bain Jacob | $205,000 | Chicago Title | |
| Ideal House Llc Series 4855 Hoyne Ave | -- | Attorney | |
| North Star Trust Company | -- | -- |
Source: Public Records
Mortgage History
| Date | Status | Borrower | Loan Amount |
|---|---|---|---|
| Previous Owner | Gylling Jason | $192,000 |
Source: Public Records
Tax History Compared to Growth
Tax History
| Year | Tax Paid | Tax Assessment Tax Assessment Total Assessment is a certain percentage of the fair market value that is determined by local assessors to be the total taxable value of land and additions on the property. | Land | Improvement |
|---|---|---|---|---|
| 2024 | $3,520 | $23,010 | $4,606 | $18,404 |
| 2023 | $3,410 | $20,000 | $3,703 | $16,297 |
| 2022 | $3,410 | $20,000 | $3,703 | $16,297 |
| 2021 | $3,352 | $19,999 | $3,703 | $16,296 |
| 2020 | $3,239 | $17,641 | $1,944 | $15,697 |
| 2019 | $3,222 | $19,466 | $1,944 | $17,522 |
| 2018 | $4,135 | $20,931 | $1,944 | $18,987 |
| 2017 | $3,080 | $14,308 | $1,666 | $12,642 |
| 2016 | $2,866 | $14,308 | $1,666 | $12,642 |
| 2015 | $2,622 | $14,308 | $1,666 | $12,642 |
| 2014 | $2,953 | $15,914 | $1,249 | $14,665 |
| 2013 | -- | $15,914 | $1,249 | $14,665 |
Source: Public Records
Map
Nearby Homes
- 4814 N Damen Ave Unit 209
- 4906 N Winchester Ave
- 1949 W Argyle St Unit 19491
- 4948 N Winchester Ave
- 5015 N Damen Ave
- 2248 W Ainslie St
- 4726 N Winchester Ave Unit C
- 4726 N Winchester Ave Unit F
- 2135 W Leland Ave
- 4909 N Wolcott Ave Unit 2B
- 4947 N Wolcott Ave Unit 1B
- 5401-5447 N Wolcott Ave
- 4929 N Wolcott Ave Unit 1A
- 5013 N Wolcott Ave Unit 3W
- 2201 W Winona St Unit 2201G
- 2224 W Eastwood Ave
- 5117 N Winchester Ave Unit 2S
- 5011 N Western Ave
- 4745 N Ravenswood Ave Unit 210
- 5221 N Hoyne Ave Unit 3
- 4855 N Hoyne Ave Unit 48551
- 4857 N Hoyne Ave Unit 48572
- 4857 N Hoyne Ave Unit 48573
- 2051 W Ainslie St Unit 20512
- 2051 W Ainslie St Unit 20513
- 2049 W Ainslie St Unit 20491
- 2051 W Ainslie St Unit 20511
- 2049 W Ainslie St Unit 20492
- 2049 W Ainslie St Unit 20493
- 4855 N Hoyne Ave Unit 48553
- 4857 N Hoyne Ave Unit 48571
- 2051 W Ainslie St Unit 2W
- 2049 W Ainslie St Unit 3E
- 4857 N Hoyne Ave Unit 3N
- 2049 W Ainslie St Unit 1E
- 2049 W Ainslie St Unit 2E
- 2051 W Ainslie St Unit 3W
- 4855 N Hoyne Ave Unit 1S
- 4855 N Hoyne Ave Unit 2S
- 4855 N Hoyne Ave Unit 2