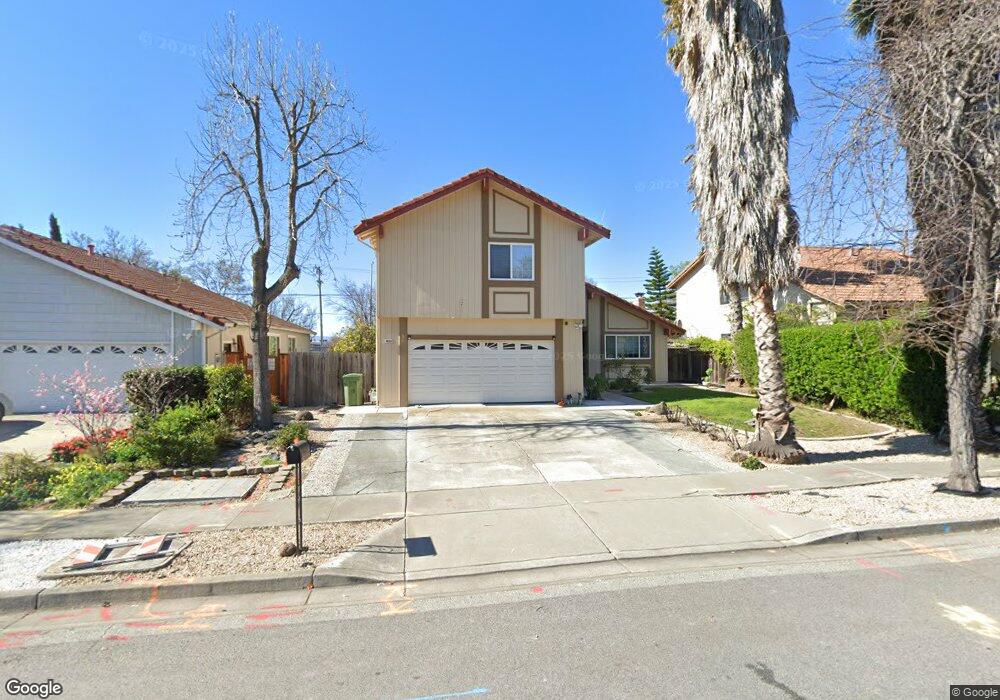
48557 Flagstaff Rd Fremont, CA 94539
Warm Springs NeighborhoodEstimated Value: $2,146,473 - $2,718,000
4
Beds
3
Baths
2,219
Sq Ft
$1,098/Sq Ft
Est. Value
About This Home
This home is located at 48557 Flagstaff Rd, Fremont, CA 94539 and is currently estimated at $2,435,368, approximately $1,097 per square foot. 48557 Flagstaff Rd is a home located in Alameda County with nearby schools including Warm Springs Elementary School, James Leitch Elementary School, and John M. Horner Junior High School.
Ownership History
Date
Name
Owned For
Owner Type
Purchase Details
Closed on
Jan 31, 2025
Sold by
Sandhu Jagjit Singh and Sandhu Gurinder Kaur
Bought by
Jg Sandhu Living Trust and Sandhu
Current Estimated Value
Purchase Details
Closed on
Oct 17, 1997
Sold by
Kenowski Michael and Kenowski Jocelyn
Bought by
Sandhu Jagjit and Sandhu Gurinder
Home Financials for this Owner
Home Financials are based on the most recent Mortgage that was taken out on this home.
Original Mortgage
$298,800
Interest Rate
7.36%
Purchase Details
Closed on
Jan 12, 1995
Sold by
Chu San Ming and Chu Tsuey Wei
Bought by
Kenowski Michael and Kenowski Jocelyn
Home Financials for this Owner
Home Financials are based on the most recent Mortgage that was taken out on this home.
Original Mortgage
$200,000
Interest Rate
9.16%
Create a Home Valuation Report for This Property
The Home Valuation Report is an in-depth analysis detailing your home's value as well as a comparison with similar homes in the area
Home Values in the Area
Average Home Value in this Area
Purchase History
| Date | Buyer | Sale Price | Title Company |
|---|---|---|---|
| Jg Sandhu Living Trust | -- | None Listed On Document | |
| Sandhu Jagjit Singh | -- | None Listed On Document | |
| Sandhu Jagjit | $332,000 | North American Title Co | |
| Kenowski Michael | $250,000 | American Title Insurance Co |
Source: Public Records
Mortgage History
| Date | Status | Borrower | Loan Amount |
|---|---|---|---|
| Previous Owner | Sandhu Jagjit | $298,800 | |
| Previous Owner | Kenowski Michael | $200,000 |
Source: Public Records
Tax History Compared to Growth
Tax History
| Year | Tax Paid | Tax Assessment Tax Assessment Total Assessment is a certain percentage of the fair market value that is determined by local assessors to be the total taxable value of land and additions on the property. | Land | Improvement |
|---|---|---|---|---|
| 2025 | $6,635 | $523,094 | $159,028 | $371,066 |
| 2024 | $6,635 | $512,701 | $155,910 | $363,791 |
| 2023 | $6,448 | $509,513 | $152,854 | $356,659 |
| 2022 | $6,351 | $492,523 | $149,857 | $349,666 |
| 2021 | $6,198 | $482,728 | $146,918 | $342,810 |
| 2020 | $6,175 | $484,710 | $145,413 | $339,297 |
| 2019 | $6,106 | $475,207 | $142,562 | $332,645 |
| 2018 | $5,984 | $465,891 | $139,767 | $326,124 |
| 2017 | $5,834 | $456,758 | $137,027 | $319,731 |
| 2016 | $5,728 | $447,804 | $134,341 | $313,463 |
| 2015 | $5,646 | $441,078 | $132,323 | $308,755 |
| 2014 | $5,543 | $432,438 | $129,731 | $302,707 |
Source: Public Records
Map
Nearby Homes
- 296 Kansas Way
- 48287 Sawleaf St
- 145 Gamma Grass Terrace Unit U256
- 48346 Cottonwood St
- 49002 Cinnamon Fern Common Unit 311
- 49100 Tomahawk Place
- 60 Wilson Way Unit 171
- 60 Wilson Way Unit 158
- 391 Gross St
- 474 Oliver St
- 1830 Vegas Ave
- 1610 Hidden Creek Ln
- 47236 Cavanaugh Common
- 392 Terra Mesa Way
- 47222 Mission Falls Ct
- 182 Rose Dr
- 114 Hackamore Ln Unit 14
- 136 Hackamore Ln Unit 18
- 281 Hackamore Common
- 199 E Warren Common
- 48539 Flagstaff Rd
- 48575 Flagstaff Rd
- 48521 Flagstaff Rd
- 48593 Flagstaff Rd
- 131 Ottawa Way
- 130 Ottawa Way
- 48611 Flagstaff Rd
- 48513 Flagstaff Rd
- 48596 Flagstaff Rd
- 145 Ottawa Way
- 144 Ottawa Way
- 133 Kansas Way
- 48619 Flagstaff Rd
- 48612 Flagstaff Rd
- 48505 Flagstaff Rd
- 161 Ottawa Way
- 160 Ottawa Way
- 155 Kansas Way
- 48620 Flagstaff Rd
- 48615 Tonopah Ct