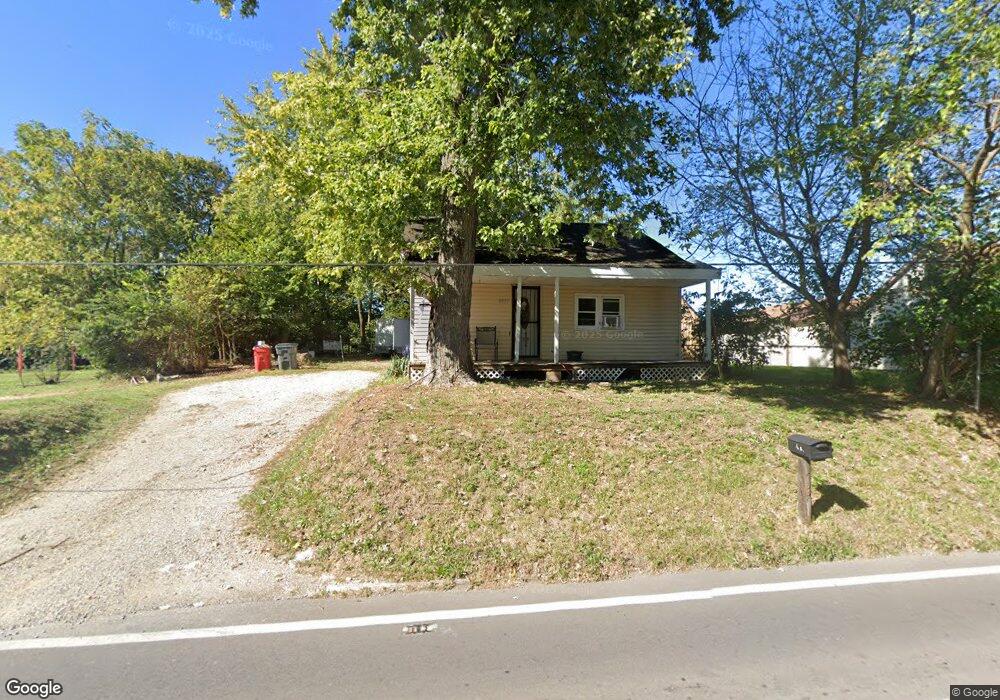
4857 Obetz Reese Rd Columbus, OH 43207
Obetz-Lockbourne NeighborhoodEstimated Value: $163,853 - $211,000
3
Beds
1
Bath
1,074
Sq Ft
$179/Sq Ft
Est. Value
About This Home
This home is located at 4857 Obetz Reese Rd, Columbus, OH 43207 and is currently estimated at $191,713, approximately $178 per square foot. 4857 Obetz Reese Rd is a home located in Franklin County with nearby schools including West Elementary School, Hamilton Elementary School, and Hamilton Intermediate School.
Ownership History
Date
Name
Owned For
Owner Type
Purchase Details
Closed on
Oct 23, 2008
Sold by
Ahl Inc
Bought by
Cassell Glenn W and Cassell Pamela J
Current Estimated Value
Purchase Details
Closed on
Nov 20, 2007
Sold by
Farris Sally J and Aames Funding Corp
Bought by
Ahl Inc
Purchase Details
Closed on
May 1, 2006
Sold by
Widger Timothy L
Bought by
Farris Sally J and Widger Sally
Purchase Details
Closed on
May 11, 2005
Sold by
Farris James B
Bought by
Widger Sally
Home Financials for this Owner
Home Financials are based on the most recent Mortgage that was taken out on this home.
Original Mortgage
$58,100
Interest Rate
11.21%
Mortgage Type
Fannie Mae Freddie Mac
Purchase Details
Closed on
May 21, 1979
Bought by
Farris James B
Create a Home Valuation Report for This Property
The Home Valuation Report is an in-depth analysis detailing your home's value as well as a comparison with similar homes in the area
Home Values in the Area
Average Home Value in this Area
Purchase History
| Date | Buyer | Sale Price | Title Company |
|---|---|---|---|
| Cassell Glenn W | $17,600 | Ohio Real T | |
| Ahl Inc | $56,000 | Public Squ | |
| Farris Sally J | -- | None Available | |
| Widger Sally | $83,000 | Tri Source Title Agency Inc | |
| Farris James B | -- | -- |
Source: Public Records
Mortgage History
| Date | Status | Borrower | Loan Amount |
|---|---|---|---|
| Previous Owner | Widger Sally | $58,100 |
Source: Public Records
Tax History Compared to Growth
Tax History
| Year | Tax Paid | Tax Assessment Tax Assessment Total Assessment is a certain percentage of the fair market value that is determined by local assessors to be the total taxable value of land and additions on the property. | Land | Improvement |
|---|---|---|---|---|
| 2024 | $1,822 | $39,870 | $3,780 | $36,090 |
| 2023 | $1,812 | $39,865 | $3,780 | $36,085 |
| 2022 | $1,928 | $35,560 | $10,010 | $25,550 |
| 2021 | $2,121 | $35,560 | $10,010 | $25,550 |
| 2020 | $2,157 | $35,560 | $10,010 | $25,550 |
| 2019 | $1,876 | $29,690 | $8,370 | $21,320 |
| 2018 | $1,512 | $29,690 | $8,370 | $21,320 |
| 2017 | $1,504 | $29,690 | $8,370 | $21,320 |
| 2016 | $1,237 | $19,120 | $4,730 | $14,390 |
| 2015 | $1,173 | $19,120 | $4,730 | $14,390 |
| 2014 | $1,167 | $19,120 | $4,730 | $14,390 |
| 2013 | $625 | $21,245 | $5,250 | $15,995 |
Source: Public Records
Map
Nearby Homes
- 1987 Reese Ave
- 1962 Reese Ave
- 1817 Marlboro Ave
- 4417 Lancaster Ave
- 1632 Marlboro Ave
- 4383 Lancaster Ave
- 1315 Webb Dr Unit Lot 93
- 1292 Webb Dr Unit Lot 83
- 1291 Webb Dr Unit Lot 90
- 4410 Holstein Dr
- 1559 Obetz Ave
- 1341 Halfhill Way
- 1099 Secrest Ave
- 5081 Lockbourne Rd
- 1566 Chillicothe St
- 4412 Catamaran Dr
- 1059 Belford Ave
- 1597 Metcalfe Ave
- 1583 Metcalfe Ave
- 4231 Umiak Dr
- 4855 Obetz Reese Rd
- 2060 Rathmell Rd
- 2050 Rathmell Rd
- 4845 Obetz Reese Rd
- 0 Ridge St
- 4848 Scioto Ave
- 2028 Lisle Ave Unit 30
- 0 Lisle Ave
- 2011 Fairfax Ave
- 2039 Roanoke Ave
- 2029 Lisle Ave
- 2023 Lisle Ave
- 2007 Fairfax Ave
- 2016 Fairfax Ave
- 4904 Ridge St Unit 4920
- 2003 Fairfax Ave
- 0 Fairfax Ave
- 2017 Lisle Ave
- 2017 Roanoke Ave
- 2017 Roanoke Ave