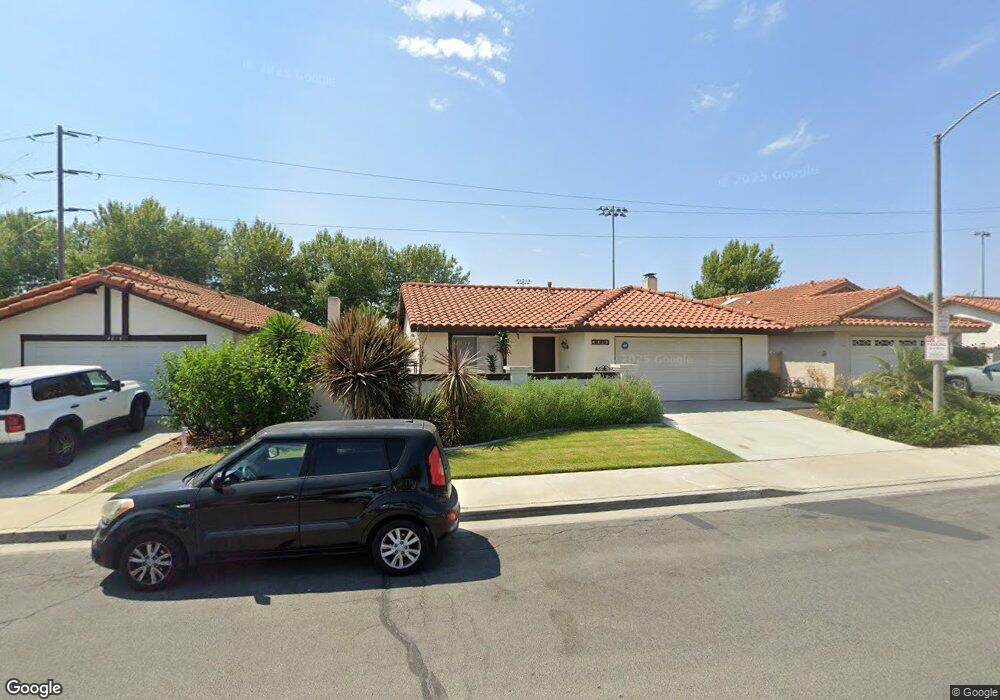
4858 Gardenia St Unit 3 Oceanside, CA 92057
San Luis Rey NeighborhoodEstimated Value: $760,249 - $816,000
4
Beds
2
Baths
1,411
Sq Ft
$559/Sq Ft
Est. Value
About This Home
This home is located at 4858 Gardenia St Unit 3, Oceanside, CA 92057 and is currently estimated at $788,312, approximately $558 per square foot. 4858 Gardenia St Unit 3 is a home located in San Diego County with nearby schools including Del Rio Elementary School, Cesar Chavez Middle School, and El Camino High School.
Ownership History
Date
Name
Owned For
Owner Type
Purchase Details
Closed on
Aug 26, 2022
Sold by
Cortes and Gladys
Bought by
Francisco And Gladys Cortes Living Trust
Current Estimated Value
Purchase Details
Closed on
Jan 2, 2015
Sold by
Hendrick Margaret A
Bought by
Cortes Francisco and Cortes Gladys
Purchase Details
Closed on
Mar 31, 2014
Sold by
Bean Stephen H
Bought by
Stephen Howard Bean Living Trust
Purchase Details
Closed on
May 18, 2001
Sold by
Schroeder Richard Henry and Schroeder Linda Louise
Bought by
Bean Stephen H
Home Financials for this Owner
Home Financials are based on the most recent Mortgage that was taken out on this home.
Original Mortgage
$193,500
Interest Rate
7.14%
Purchase Details
Closed on
Feb 28, 1986
Purchase Details
Closed on
Sep 20, 1985
Create a Home Valuation Report for This Property
The Home Valuation Report is an in-depth analysis detailing your home's value as well as a comparison with similar homes in the area
Home Values in the Area
Average Home Value in this Area
Purchase History
| Date | Buyer | Sale Price | Title Company |
|---|---|---|---|
| Francisco And Gladys Cortes Living Trust | -- | Barger & Battiest Law Apc | |
| Cortes Francisco | $343,000 | First American Title Company | |
| Stephen Howard Bean Living Trust | -- | None Available | |
| Bean Stephen H | $215,000 | -- | |
| -- | $96,500 | -- | |
| -- | $90,700 | -- |
Source: Public Records
Mortgage History
| Date | Status | Borrower | Loan Amount |
|---|---|---|---|
| Previous Owner | Bean Stephen H | $193,500 |
Source: Public Records
Tax History Compared to Growth
Tax History
| Year | Tax Paid | Tax Assessment Tax Assessment Total Assessment is a certain percentage of the fair market value that is determined by local assessors to be the total taxable value of land and additions on the property. | Land | Improvement |
|---|---|---|---|---|
| 2025 | $4,565 | $411,744 | $264,403 | $147,341 |
| 2024 | $4,565 | $403,671 | $259,219 | $144,452 |
| 2023 | $4,424 | $395,757 | $254,137 | $141,620 |
| 2022 | $4,357 | $387,998 | $249,154 | $138,844 |
| 2021 | $4,375 | $380,391 | $244,269 | $136,122 |
| 2020 | $4,240 | $376,492 | $241,765 | $134,727 |
| 2019 | $4,117 | $369,111 | $237,025 | $132,086 |
| 2018 | $4,074 | $361,875 | $232,378 | $129,497 |
| 2017 | $3,999 | $354,780 | $227,822 | $126,958 |
| 2016 | $3,870 | $347,824 | $223,355 | $124,469 |
| 2015 | $3,682 | $342,600 | $220,000 | $122,600 |
| 2014 | $2,786 | $265,043 | $141,355 | $123,688 |
Source: Public Records
Map
Nearby Homes
- 4843 Sagina Ct Unit 6
- 4819 Gardenia St
- 4791 Macadamia Ct
- 4827 Luna Dr
- 267 Oleander Dr
- 207 Carissa Dr
- 4816 Siesta Dr
- 5037 Los Morros Way Unit 71
- 150 N River Cir Unit 105
- 5110 N River Rd Unit E
- 5045 Los Morros Way Unit 78
- 5202 Via Tizon
- 1 Calle Mariposa
- 534 Luna Dr
- 530 Roja Dr
- 538 Luna Dr
- 790 Mosaic Cir
- 5030 Gavilan Way Unit 45
- 517 Calle Montecito Unit 91
- 514 Calle Montecito Unit 78
- 4862 Gardenia St
- 4854 Gardenia St
- 4866 Gardenia St
- 4839 Sumac Place
- 4870 Gardenia St
- 4844 Sumac Place
- 4843 Sumac Place
- 4874 Gardenia St
- 205 Saguaro Place
- 4856 Sumac Place
- 4863 Gardenia St
- 4847 Sumac Place Unit 3
- 4873 Gardenia St
- 4878 Gardenia St
- 4859 Gardenia St
- 209 Saguaro Place
- 4851 Sumac Place
- 4864 Sumac Place
- 4882 Gardenia St
- 4877 Gardenia St