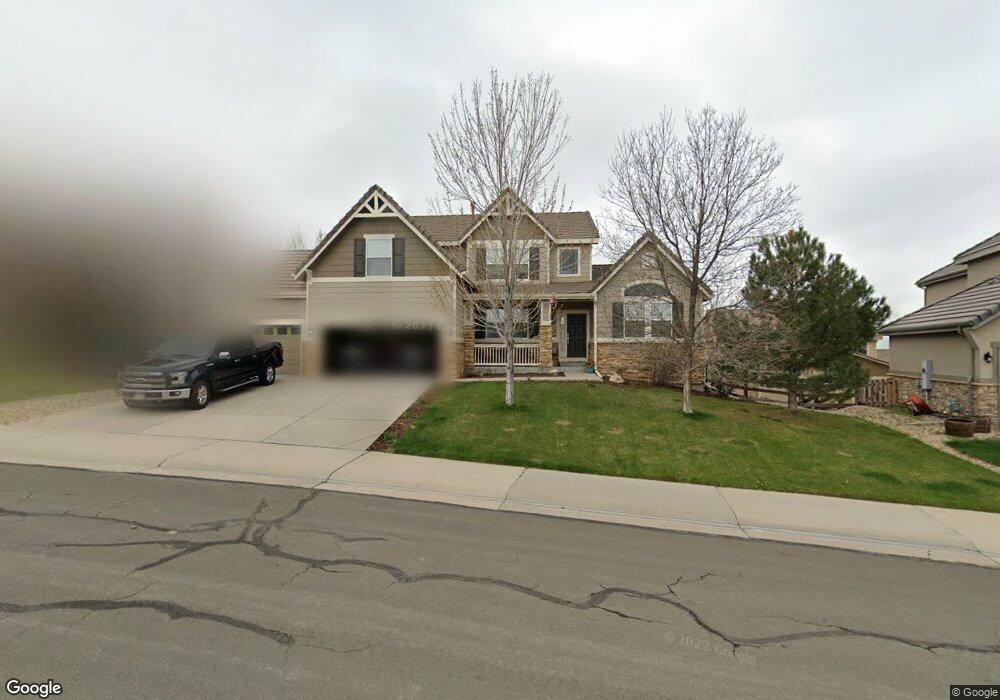
4858 Guernsey Loop Castle Rock, CO 80109
The Meadows NeighborhoodEstimated Value: $763,000 - $868,000
3
Beds
3
Baths
5,298
Sq Ft
$150/Sq Ft
Est. Value
About This Home
This home is located at 4858 Guernsey Loop, Castle Rock, CO 80109 and is currently estimated at $793,649, approximately $149 per square foot. 4858 Guernsey Loop is a home located in Douglas County with nearby schools including Soaring Hawk Elementary School, Castle Rock Middle School, and Castle View High School.
Ownership History
Date
Name
Owned For
Owner Type
Purchase Details
Closed on
Jul 29, 2015
Sold by
Smith David S
Bought by
Zimmerman David Tyler and Zimmerman Kelly Elizabeth
Current Estimated Value
Home Financials for this Owner
Home Financials are based on the most recent Mortgage that was taken out on this home.
Original Mortgage
$307,000
Outstanding Balance
$241,782
Interest Rate
4.07%
Mortgage Type
VA
Estimated Equity
$551,867
Purchase Details
Closed on
Jun 11, 2008
Sold by
Smith Joan S
Bought by
Smith David S
Purchase Details
Closed on
May 16, 2007
Sold by
Richmond American Homes Of Colorado Inc
Bought by
Smith David S and Smith Joan S
Home Financials for this Owner
Home Financials are based on the most recent Mortgage that was taken out on this home.
Original Mortgage
$403,672
Interest Rate
6.16%
Mortgage Type
Unknown
Create a Home Valuation Report for This Property
The Home Valuation Report is an in-depth analysis detailing your home's value as well as a comparison with similar homes in the area
Home Values in the Area
Average Home Value in this Area
Purchase History
| Date | Buyer | Sale Price | Title Company |
|---|---|---|---|
| Zimmerman David Tyler | $479,900 | North American Title | |
| Smith David S | -- | None Available | |
| Smith David S | $504,600 | None Available |
Source: Public Records
Mortgage History
| Date | Status | Borrower | Loan Amount |
|---|---|---|---|
| Open | Zimmerman David Tyler | $307,000 | |
| Previous Owner | Smith David S | $403,672 |
Source: Public Records
Tax History Compared to Growth
Tax History
| Year | Tax Paid | Tax Assessment Tax Assessment Total Assessment is a certain percentage of the fair market value that is determined by local assessors to be the total taxable value of land and additions on the property. | Land | Improvement |
|---|---|---|---|---|
| 2024 | $5,329 | $54,780 | $12,880 | $41,900 |
| 2023 | $5,378 | $54,780 | $12,880 | $41,900 |
| 2022 | $3,885 | $38,230 | $8,950 | $29,280 |
| 2021 | $4,035 | $38,230 | $8,950 | $29,280 |
| 2020 | $3,814 | $36,990 | $8,210 | $28,780 |
| 2019 | $3,827 | $36,990 | $8,210 | $28,780 |
| 2018 | $3,611 | $34,320 | $6,240 | $28,080 |
| 2017 | $3,407 | $34,320 | $6,240 | $28,080 |
| 2016 | $3,419 | $33,850 | $5,940 | $27,910 |
| 2015 | $3,483 | $33,850 | $5,940 | $27,910 |
| 2014 | $2,958 | $27,140 | $5,570 | $21,570 |
Source: Public Records
Map
Nearby Homes
- 2081 Gypsy Moth Ct
- 5238 Gould Cir
- 2310 Woodhouse Ln
- 4245 Prairie Rose Cir
- 4298 Abstract St
- 2880 Breezy Ln
- 4219 Opportunity Dr
- 2339 Robindale Way
- 2877 Craig Ct
- 4433 Prairie Rose Cir
- 1815 Avery Way
- 4351 Applecrest Cir
- 4408 Applecrest Cir
- 2872 Feather Ct
- 2980 Craig Ct
- 3048 Starling Ct
- 2934 Feather Ct
- 3066 Craig Ct
- 2002 Quartz St
- 3091 Craig Ct
- 4836 Guernsey Loop
- 4882 Guernsey Loop
- 5058 Gould Cir
- 4905 Persimmon Ln
- 4822 Guernsey Loop
- 5074 Gould Cir
- 4893 Persimmon Ln
- 4917 Persimmon Ln
- 5082 Gould Cir
- 4808 Guernsey Loop
- 5041 Gould Cir
- 5055 Gould Cir
- 4879 Persimmon Ln
- 5027 Gould Cir
- 5069 Gould Cir
- 5015 Gould Cir
- 4931 Persimmon Ln
- 5083 Gould Cir
- 5098 Gould Cir
- 4865 Persimmon Ln