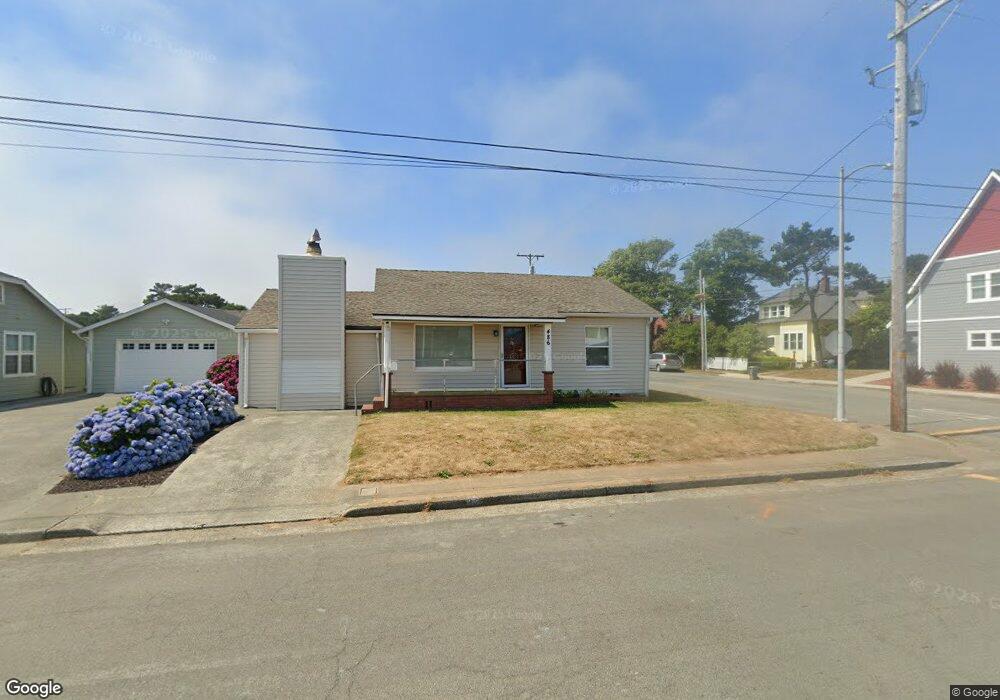
486 4th St Crescent City, CA 95531
Estimated Value: $224,528 - $356,000
2
Beds
1
Bath
1,215
Sq Ft
$241/Sq Ft
Est. Value
About This Home
This home is located at 486 4th St, Crescent City, CA 95531 and is currently estimated at $293,132, approximately $241 per square foot. 486 4th St is a home located in Del Norte County with nearby schools including Joe Hamilton Elementary School, Crescent Elk Middle School, and Del Norte High School.
Ownership History
Date
Name
Owned For
Owner Type
Purchase Details
Closed on
Jan 19, 2016
Sold by
Messal Cory and Messal Mary
Bought by
Cory Messal & Mary Messal 2016 Trust
Current Estimated Value
Purchase Details
Closed on
Aug 5, 2010
Sold by
Dale Joanne K
Bought by
Messal Cory and Messal Mary K
Home Financials for this Owner
Home Financials are based on the most recent Mortgage that was taken out on this home.
Original Mortgage
$125,000
Outstanding Balance
$82,511
Interest Rate
4.51%
Mortgage Type
Seller Take Back
Estimated Equity
$210,621
Create a Home Valuation Report for This Property
The Home Valuation Report is an in-depth analysis detailing your home's value as well as a comparison with similar homes in the area
Home Values in the Area
Average Home Value in this Area
Purchase History
| Date | Buyer | Sale Price | Title Company |
|---|---|---|---|
| Cory Messal & Mary Messal 2016 Trust | -- | None Available | |
| Messal Cory | $125,000 | Crescent Land Title Company |
Source: Public Records
Mortgage History
| Date | Status | Borrower | Loan Amount |
|---|---|---|---|
| Open | Messal Cory | $125,000 |
Source: Public Records
Tax History
| Year | Tax Paid | Tax Assessment Tax Assessment Total Assessment is a certain percentage of the fair market value that is determined by local assessors to be the total taxable value of land and additions on the property. | Land | Improvement |
|---|---|---|---|---|
| 2025 | $958 | $89,670 | $51,240 | $38,430 |
| 2024 | $919 | $87,913 | $50,236 | $37,677 |
| 2023 | $899 | $86,190 | $49,251 | $36,939 |
| 2022 | $880 | $84,501 | $48,286 | $36,215 |
| 2021 | $875 | $82,845 | $47,340 | $35,505 |
| 2020 | $869 | $81,996 | $46,855 | $35,141 |
| 2019 | $855 | $80,389 | $45,937 | $34,452 |
| 2018 | $837 | $78,814 | $45,037 | $33,777 |
| 2017 | $823 | $77,269 | $44,154 | $33,115 |
| 2016 | $809 | $75,755 | $43,289 | $32,466 |
| 2015 | $790 | $74,618 | $42,639 | $31,979 |
| 2014 | $782 | $73,157 | $41,804 | $31,353 |
Source: Public Records
Map
Nearby Homes
Your Personal Tour Guide
Ask me questions while you tour the home.