486 Crouse St Unit 2 Akron, OH 44311
Downtown Akron NeighborhoodEstimated Value: $109,313 - $152,000
3
Beds
1
Bath
900
Sq Ft
$154/Sq Ft
Est. Value
About This Home
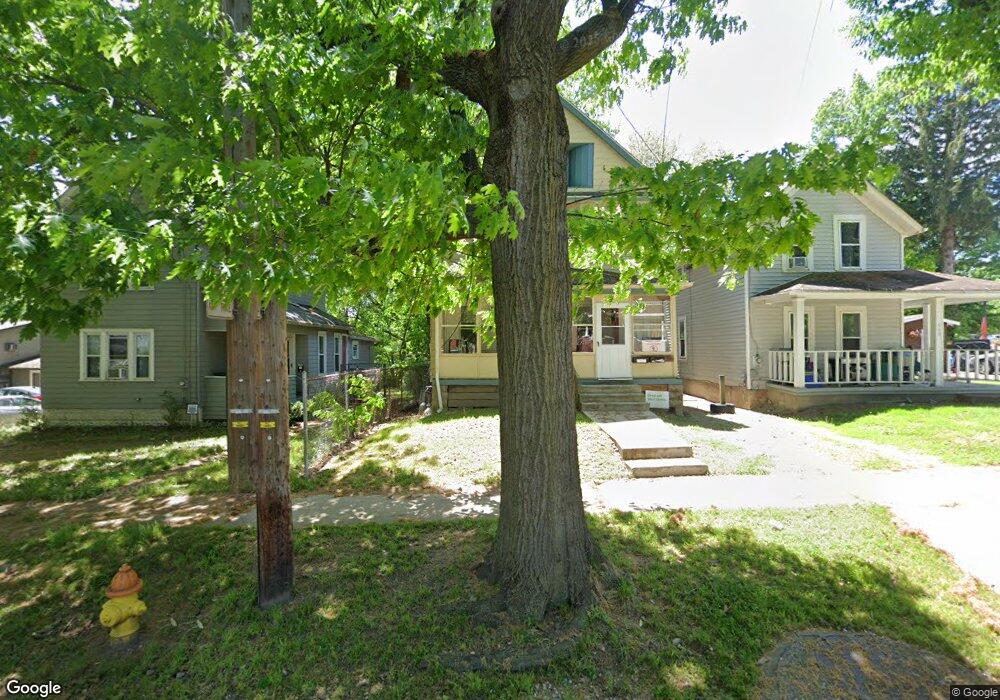
This home is located at 486 Crouse St Unit 2, Akron, OH 44311 and is currently estimated at $138,328, approximately $153 per square foot. 486 Crouse St Unit 2 is a home located in Summit County with nearby schools including North High School, Case Preparatory Academy, and Middlebury Academy.
Ownership History
Date
Name
Owned For
Owner Type
Purchase Details
Closed on
Jun 23, 2022
Sold by
Matthew Westfall G and Matthew Teri
Bought by
Plancarte Luis
Current Estimated Value
Purchase Details
Closed on
Dec 22, 1999
Sold by
Matthew Westfall G and Kessler Joseph M
Bought by
Westfall G Matthew and Westfall Teri
Home Financials for this Owner
Home Financials are based on the most recent Mortgage that was taken out on this home.
Original Mortgage
$45,000
Interest Rate
7%
Create a Home Valuation Report for This Property
The Home Valuation Report is an in-depth analysis detailing your home's value as well as a comparison with similar homes in the area
Home Values in the Area
Average Home Value in this Area
Purchase History
| Date | Buyer | Sale Price | Title Company |
|---|---|---|---|
| Plancarte Luis | $139,900 | Minnesota Title Agency | |
| Westfall G Matthew | $25,200 | Minnesota Insured Title Agen |
Source: Public Records
Mortgage History
| Date | Status | Borrower | Loan Amount |
|---|---|---|---|
| Previous Owner | Westfall G Matthew | $45,000 |
Source: Public Records
Tax History
| Year | Tax Paid | Tax Assessment Tax Assessment Total Assessment is a certain percentage of the fair market value that is determined by local assessors to be the total taxable value of land and additions on the property. | Land | Improvement |
|---|---|---|---|---|
| 2024 | $1,867 | $33,384 | $6,682 | $26,702 |
| 2023 | $1,867 | $33,384 | $6,682 | $26,702 |
| 2022 | $1,590 | $22,106 | $4,424 | $17,682 |
| 2021 | $1,592 | $22,106 | $4,424 | $17,682 |
| 2020 | $1,569 | $22,100 | $4,420 | $17,680 |
| 2019 | $1,463 | $19,290 | $4,420 | $14,870 |
| 2018 | $1,444 | $19,290 | $4,420 | $14,870 |
| 2017 | $1,279 | $19,290 | $4,420 | $14,870 |
| 2016 | $1,280 | $16,700 | $4,420 | $12,280 |
| 2015 | $1,279 | $16,700 | $4,420 | $12,280 |
| 2014 | $1,269 | $16,700 | $4,420 | $12,280 |
| 2013 | $1,377 | $18,590 | $4,420 | $14,170 |
Source: Public Records
Map
Nearby Homes
- 486 Crouse St
- 484 Crouse St
- 492 Crouse St
- 480 Crouse St
- 487 Crouse St
- 485 487 Crouse St
- 504 Crouse St
- 475 Crouse St
- 485 Crouse St Unit 487
- 517 Gage St
- 499 Crouse St
- 513 Gage St Unit 515
- 527 Gage St
- 509 Gage St
- 505 Crouse St
- 523 Gage St Unit Up
- 523 Gage St Unit 2
- 531 Gage St
- 510 Crouse St
- 503 Gage St
Your Personal Tour Guide
Ask me questions while you tour the home.