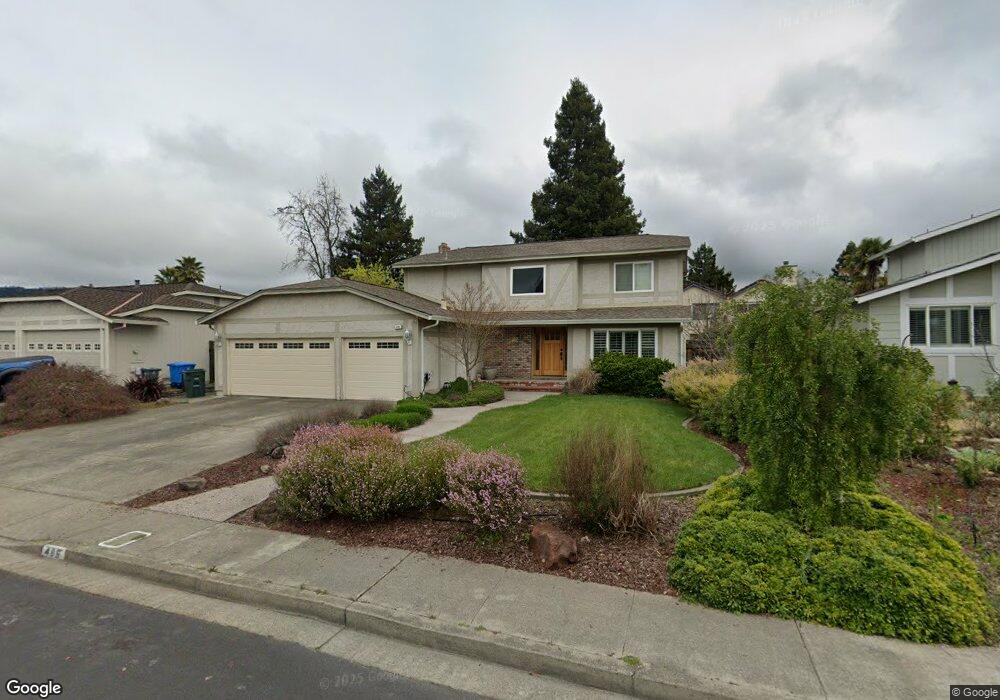
486 Floral Way Rohnert Park, CA 94928
Estimated Value: $765,000 - $913,000
4
Beds
3
Baths
2,104
Sq Ft
$408/Sq Ft
Est. Value
About This Home
This home is located at 486 Floral Way, Rohnert Park, CA 94928 and is currently estimated at $857,827, approximately $407 per square foot. 486 Floral Way is a home located in Sonoma County with nearby schools including Rancho Cotate High School and Cross & Crown Lutheran School.
Ownership History
Date
Name
Owned For
Owner Type
Purchase Details
Closed on
Oct 2, 2015
Sold by
Gonzalez Lisa S and Gonzalez Fernando R
Bought by
The Fernando R Gonzalez & Lisa S Gonzale
Current Estimated Value
Purchase Details
Closed on
Aug 7, 2002
Sold by
Brannen George and Brannen Dana
Bought by
Gonzalez Fernando R and Gonzalez Lisa S
Home Financials for this Owner
Home Financials are based on the most recent Mortgage that was taken out on this home.
Original Mortgage
$326,885
Outstanding Balance
$139,013
Interest Rate
6.62%
Estimated Equity
$718,814
Purchase Details
Closed on
Aug 19, 1996
Sold by
Morilla Michael J and Intervivos Phyllis B
Bought by
Brannen George and Brannen Dana
Home Financials for this Owner
Home Financials are based on the most recent Mortgage that was taken out on this home.
Original Mortgage
$204,250
Interest Rate
8.2%
Create a Home Valuation Report for This Property
The Home Valuation Report is an in-depth analysis detailing your home's value as well as a comparison with similar homes in the area
Home Values in the Area
Average Home Value in this Area
Purchase History
| Date | Buyer | Sale Price | Title Company |
|---|---|---|---|
| The Fernando R Gonzalez & Lisa S Gonzale | -- | None Available | |
| Gonzalez Fernando R | $435,000 | North Bay Title Co | |
| Brannen George | $215,000 | North Bay Title Co |
Source: Public Records
Mortgage History
| Date | Status | Borrower | Loan Amount |
|---|---|---|---|
| Open | Gonzalez Fernando R | $326,885 | |
| Previous Owner | Brannen George | $204,250 |
Source: Public Records
Tax History Compared to Growth
Tax History
| Year | Tax Paid | Tax Assessment Tax Assessment Total Assessment is a certain percentage of the fair market value that is determined by local assessors to be the total taxable value of land and additions on the property. | Land | Improvement |
|---|---|---|---|---|
| 2025 | $7,079 | $630,021 | $217,247 | $412,774 |
| 2024 | $7,079 | $617,669 | $212,988 | $404,681 |
| 2023 | $7,079 | $605,559 | $208,812 | $396,747 |
| 2022 | $6,936 | $593,686 | $204,718 | $388,968 |
| 2021 | $6,878 | $582,046 | $200,704 | $381,342 |
| 2020 | $6,979 | $576,079 | $198,647 | $377,432 |
| 2019 | $6,887 | $564,784 | $194,752 | $370,032 |
| 2018 | $6,752 | $553,711 | $190,934 | $362,777 |
| 2017 | $6,636 | $542,855 | $187,191 | $355,664 |
| 2016 | $6,363 | $532,212 | $183,521 | $348,691 |
| 2015 | $6,205 | $524,219 | $180,765 | $343,454 |
| 2014 | $5,411 | $451,000 | $156,000 | $295,000 |
Source: Public Records
Map
Nearby Homes
- 27 Fredrick Dr
- 159 Francis Cir
- 15 Francis Cir
- 5720 Dexter Cir Unit C
- 5032 Country Club Dr
- 5741 Davis Cir
- 239 Fauna Ave
- 954 Eleanor Ave
- 978 Eleanor Ave
- 1026 Eleanor Ave Unit A
- 1044 Eleanor Ave
- 5781 Dolores Dr
- 4484 Flores Ave
- 690 Holly Ave
- 914 Santa Dorotea Cir
- 1140 Emily Ave
- 1106 Elvera St
- 6061 Della Ct
- 6032 Elsa Ave
- 6093 Donna Ct