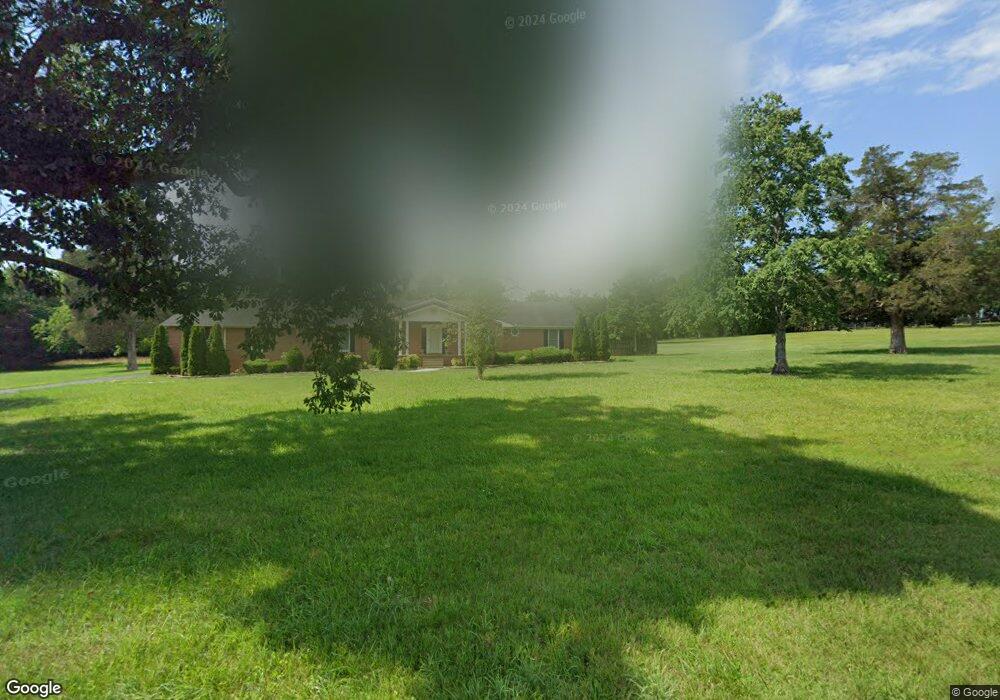
486 Naron Rd Shelbyville, TN 37160
Estimated Value: $726,000 - $785,548
--
Bed
3
Baths
3,530
Sq Ft
$214/Sq Ft
Est. Value
About This Home
This home is located at 486 Naron Rd, Shelbyville, TN 37160 and is currently estimated at $755,774, approximately $214 per square foot. 486 Naron Rd is a home located in Bedford County with nearby schools including Liberty Elementary School.
Ownership History
Date
Name
Owned For
Owner Type
Purchase Details
Closed on
Dec 11, 2013
Sold by
Webster Frances E
Bought by
King F Z and King Connie S
Current Estimated Value
Purchase Details
Closed on
Jun 12, 2008
Sold by
Webster Frances E
Bought by
Webster Frances E
Purchase Details
Closed on
Feb 11, 2005
Sold by
Webster Frank A
Bought by
King F Z
Purchase Details
Closed on
Nov 20, 2000
Sold by
Collins Ruth S
Bought by
King F Z Connie
Purchase Details
Closed on
Dec 14, 1990
Bought by
Webster Frank A and Webster Frances E
Purchase Details
Closed on
Oct 18, 1979
Bought by
Webster Frank A and Webster Frances E
Purchase Details
Closed on
Nov 8, 1978
Bought by
Webster Frank A and Webster Frances E
Create a Home Valuation Report for This Property
The Home Valuation Report is an in-depth analysis detailing your home's value as well as a comparison with similar homes in the area
Home Values in the Area
Average Home Value in this Area
Purchase History
| Date | Buyer | Sale Price | Title Company |
|---|---|---|---|
| King F Z | $38,000 | -- | |
| Webster Frances E | -- | -- | |
| King F Z | $320 | -- | |
| King F Z Connie | $32,000 | -- | |
| Webster Frank A | -- | -- | |
| Webster Frank A | -- | -- | |
| Webster Frank A | -- | -- |
Source: Public Records
Tax History Compared to Growth
Tax History
| Year | Tax Paid | Tax Assessment Tax Assessment Total Assessment is a certain percentage of the fair market value that is determined by local assessors to be the total taxable value of land and additions on the property. | Land | Improvement |
|---|---|---|---|---|
| 2025 | $2,640 | $113,550 | $0 | $0 |
| 2024 | $2,640 | $113,550 | $11,900 | $101,650 |
| 2023 | $2,493 | $107,225 | $11,900 | $95,325 |
| 2022 | $2,493 | $107,225 | $11,900 | $95,325 |
| 2021 | $2,107 | $107,225 | $11,900 | $95,325 |
| 2020 | $1,893 | $107,225 | $11,900 | $95,325 |
| 2019 | $1,893 | $71,150 | $8,050 | $63,100 |
| 2018 | $1,821 | $71,150 | $8,050 | $63,100 |
| 2017 | $1,821 | $71,150 | $8,050 | $63,100 |
| 2016 | $1,793 | $71,150 | $0 | $0 |
| 2015 | $1,793 | $71,150 | $0 | $0 |
| 2014 | $1,478 | $65,105 | $0 | $0 |
Source: Public Records
Map
Nearby Homes