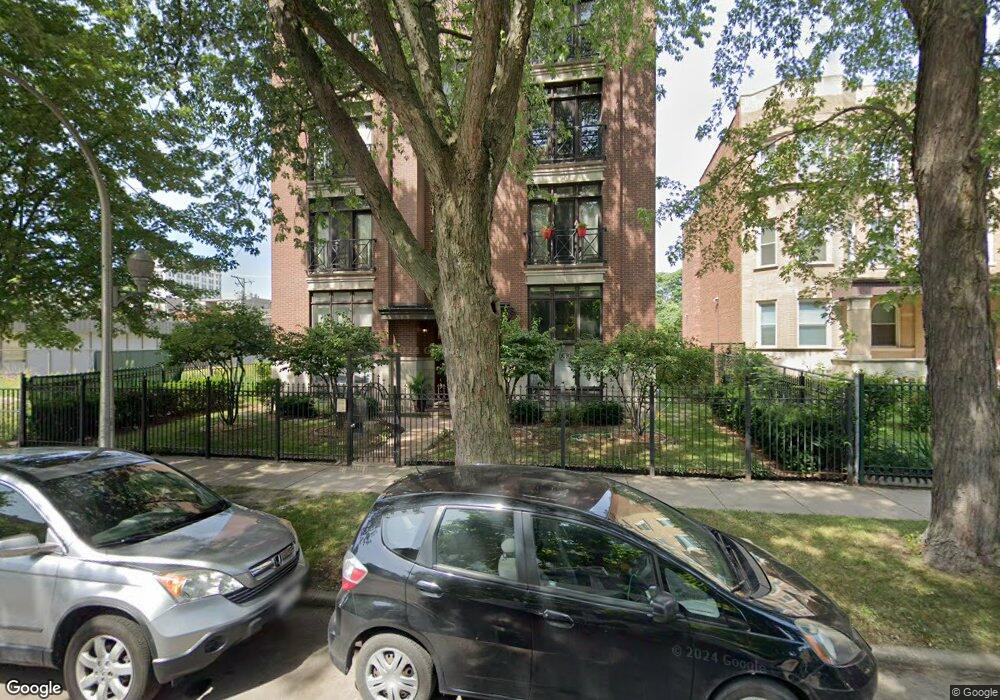
4860 N Kenmore Ave Unit 3S Chicago, IL 60640
Sheridan Park NeighborhoodEstimated Value: $430,508 - $461,000
2
Beds
2
Baths
1,400
Sq Ft
$318/Sq Ft
Est. Value
About This Home
This home is located at 4860 N Kenmore Ave Unit 3S, Chicago, IL 60640 and is currently estimated at $445,169, approximately $317 per square foot. 4860 N Kenmore Ave Unit 3S is a home located in Cook County with nearby schools including Mccutcheon Elementary School, Senn High School, and St Thomas Of Canterbury School.
Ownership History
Date
Name
Owned For
Owner Type
Purchase Details
Closed on
Aug 12, 2011
Sold by
Laurila Jay
Bought by
Tomita David
Current Estimated Value
Home Financials for this Owner
Home Financials are based on the most recent Mortgage that was taken out on this home.
Original Mortgage
$196,500
Interest Rate
4.32%
Mortgage Type
New Conventional
Purchase Details
Closed on
Jul 27, 2006
Sold by
Husemoller Paul R
Bought by
Laurila Jay
Home Financials for this Owner
Home Financials are based on the most recent Mortgage that was taken out on this home.
Original Mortgage
$259,200
Interest Rate
6.85%
Mortgage Type
Unknown
Purchase Details
Closed on
Jan 14, 2002
Sold by
Kenmore Partners Llc
Bought by
Husemoller Paul R
Home Financials for this Owner
Home Financials are based on the most recent Mortgage that was taken out on this home.
Original Mortgage
$185,000
Interest Rate
6.37%
Create a Home Valuation Report for This Property
The Home Valuation Report is an in-depth analysis detailing your home's value as well as a comparison with similar homes in the area
Home Values in the Area
Average Home Value in this Area
Purchase History
| Date | Buyer | Sale Price | Title Company |
|---|---|---|---|
| Tomita David | $262,000 | First American Title Ins Co | |
| Laurila Jay | $324,000 | Pntn | |
| Husemoller Paul R | $246,000 | Ticor Title Insurance |
Source: Public Records
Mortgage History
| Date | Status | Borrower | Loan Amount |
|---|---|---|---|
| Previous Owner | Tomita David | $196,500 | |
| Previous Owner | Laurila Jay | $259,200 | |
| Previous Owner | Husemoller Paul R | $185,000 |
Source: Public Records
Tax History Compared to Growth
Tax History
| Year | Tax Paid | Tax Assessment Tax Assessment Total Assessment is a certain percentage of the fair market value that is determined by local assessors to be the total taxable value of land and additions on the property. | Land | Improvement |
|---|---|---|---|---|
| 2024 | $5,366 | $32,481 | $7,711 | $24,770 |
| 2023 | $5,210 | $28,750 | $6,210 | $22,540 |
| 2022 | $5,210 | $28,750 | $6,210 | $22,540 |
| 2021 | $5,112 | $28,750 | $6,210 | $22,540 |
| 2020 | $4,823 | $24,754 | $4,761 | $19,993 |
| 2019 | $4,845 | $27,546 | $4,761 | $22,785 |
| 2018 | $4,287 | $27,546 | $4,761 | $22,785 |
| 2017 | $4,668 | $25,059 | $4,140 | $20,919 |
| 2016 | $5,578 | $29,481 | $4,140 | $25,341 |
| 2015 | $5,090 | $29,481 | $4,140 | $25,341 |
| 2014 | $4,527 | $26,246 | $3,156 | $23,090 |
| 2013 | $4,295 | $26,246 | $3,156 | $23,090 |
Source: Public Records
Map
Nearby Homes
- 4879 N Winthrop Ave Unit D
- 4933 N Winthrop Ave Unit 2S
- 4911 N Kenmore Ave Unit 1S
- 4834 N Kenmore Ave Unit 3N
- 4936 N Winthrop Ave Unit 1E
- 4826 N Winthrop Ave Unit 2S
- 4848 N Sheridan Rd Unit 710
- 1057 W Argyle St Unit 3
- 4932 N Sheridan Rd
- 912 W Margate Terrace Unit 2
- 847 W Ainslie St Unit 3E
- 847 W Ainslie St Unit 3W
- 847 W Ainslie St Unit 1E
- 847 W Ainslie St Unit 1W
- 847 W Ainslie St Unit 2E
- 1225 W Carmen Ave Unit 1N
- 1019 W Winona St Unit P9
- 4715 N Racine Ave Unit 305
- 1000 W Leland Ave Unit 12G
- 5100 N Sheridan Rd Unit 410
- 4860 N Kenmore Ave Unit 3N
- 4860 N Kenmore Ave Unit 1N
- 4860 N Kenmore Ave Unit 2N
- 4860 N Kenmore Ave Unit 4N
- 4860 N Kenmore Ave Unit 1S
- 4860 N Kenmore Ave Unit 2S
- 4862 N Kenmore Ave Unit 2P
- 4862 N Kenmore Ave Unit 3P
- 4862 N Kenmore Ave Unit 1P
- 4862 N Kenmore Ave Unit 4P
- 4862 N Kenmore Ave Unit 3N
- 4862 N Kenmore Ave Unit 2N
- 4862 N Kenmore Ave Unit 1N
- 4858 N Kenmore Ave
- 4858 N Kenmore Ave Unit 1N
- 4858 N Kenmore Ave Unit 3N
- 4858 N Kenmore Ave Unit 1W
- 4858 N Kenmore Ave Unit 2N
- 4858 N Kenmore Ave Unit 3S
- 4858 N Kenmore Ave Unit 2S