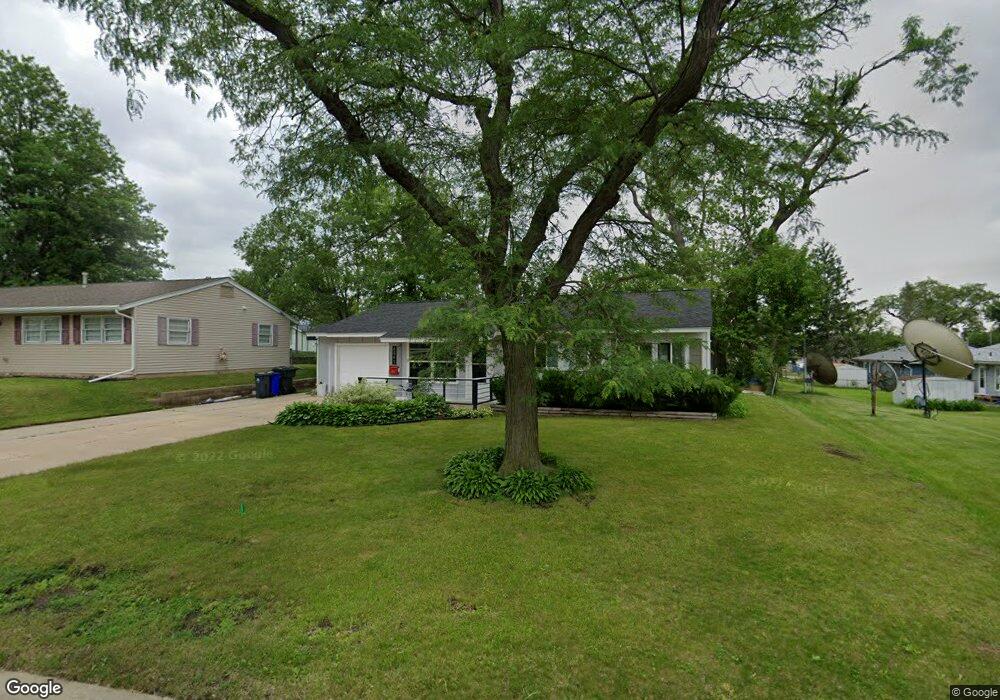
4861 Ford Ave NW Cedar Rapids, IA 52405
Cherry Hill Park NeighborhoodEstimated Value: $161,084 - $167,000
3
Beds
1
Bath
1,008
Sq Ft
$163/Sq Ft
Est. Value
About This Home
This home is located at 4861 Ford Ave NW, Cedar Rapids, IA 52405 and is currently estimated at $164,771, approximately $163 per square foot. 4861 Ford Ave NW is a home located in Linn County with nearby schools including Junction City Elementary School, Hoover Elementary School, and Kentucky Tech - Ashland Reg Tech Center.
Ownership History
Date
Name
Owned For
Owner Type
Purchase Details
Closed on
Nov 8, 2023
Sold by
Petty Nancie Jo
Bought by
Petty Jacob Matthew
Current Estimated Value
Purchase Details
Closed on
Sep 12, 2003
Sold by
Muters Scott A and Muters Jessica M
Bought by
Petty Nancie J
Home Financials for this Owner
Home Financials are based on the most recent Mortgage that was taken out on this home.
Original Mortgage
$85,821
Interest Rate
6.44%
Mortgage Type
FHA
Purchase Details
Closed on
May 25, 2000
Sold by
Ivins Michael W and Ivins Ramona J
Bought by
Muters Scott A and Muters Jessica M
Home Financials for this Owner
Home Financials are based on the most recent Mortgage that was taken out on this home.
Original Mortgage
$75,907
Interest Rate
8.13%
Mortgage Type
FHA
Create a Home Valuation Report for This Property
The Home Valuation Report is an in-depth analysis detailing your home's value as well as a comparison with similar homes in the area
Home Values in the Area
Average Home Value in this Area
Purchase History
| Date | Buyer | Sale Price | Title Company |
|---|---|---|---|
| Petty Jacob Matthew | -- | None Listed On Document | |
| Petty Jacob Matthew | -- | None Listed On Document | |
| Petty Nancie J | $86,000 | -- | |
| Muters Scott A | $76,000 | -- |
Source: Public Records
Mortgage History
| Date | Status | Borrower | Loan Amount |
|---|---|---|---|
| Previous Owner | Petty Nancie J | $85,821 | |
| Previous Owner | Muters Scott A | $75,907 |
Source: Public Records
Tax History Compared to Growth
Tax History
| Year | Tax Paid | Tax Assessment Tax Assessment Total Assessment is a certain percentage of the fair market value that is determined by local assessors to be the total taxable value of land and additions on the property. | Land | Improvement |
|---|---|---|---|---|
| 2025 | $2,148 | $150,900 | $33,200 | $117,700 |
| 2024 | $2,306 | $139,800 | $28,600 | $111,200 |
| 2023 | $2,306 | $131,800 | $28,600 | $103,200 |
| 2022 | $2,246 | $118,200 | $24,100 | $94,100 |
| 2021 | $2,198 | $117,400 | $24,100 | $93,300 |
| 2020 | $2,198 | $108,200 | $19,600 | $88,600 |
| 2019 | $2,048 | $103,500 | $19,600 | $83,900 |
Source: Public Records
Map
Nearby Homes
- 236 Jacolyn Dr NW
- 281 Jacolyn Dr NW
- 208 Lenora Dr NW
- 4520 Ford Ave NW
- 5127 Holly Ave NW
- 408 Jacolyn Dr NW
- 602 Olive Dr NW
- 410 Wiley Blvd NW
- 332 Carter St NW
- 4622 1st Ave NW Unit E
- 3979 Cox Ave NW
- 4619 1st Ave SW Unit 3
- 5730 D Ave NW
- 56 Julia Ann Dr NW
- 323 Norwick Rd SW
- 5918 Sharon Ln NW
- 3600 Midway Dr NW
- 3724 2nd Ave SW
- 6008 Eastview Ave SW
- 3509 E Ave NW Unit D
- 249 Jacolyn Dr NW
- 243 Jacolyn Ct NW
- 247 Jacolyn Dr NW
- 4847 Ford Ave NW
- 245 Jacolyn Dr NW
- 253 Jacolyn Dr NW
- 4860 Ford Ave NW
- 241 Jacolyn Ct NW
- 4850 Ford Ave NW
- 4843 Ford Ave NW
- 257 Jacolyn Dr NW
- 4840 Ford Ave NW
- 239 Jacolyn Ct NW
- 248 Jacolyn Dr NW
- 267 Peace Ave NW
- 250 Jacolyn Dr NW
- 4833 Ford Ave NW
- 235 Jacolyn Dr NW
- 4830 Ford Ave NW
- 252 Jacolyn Dr NW