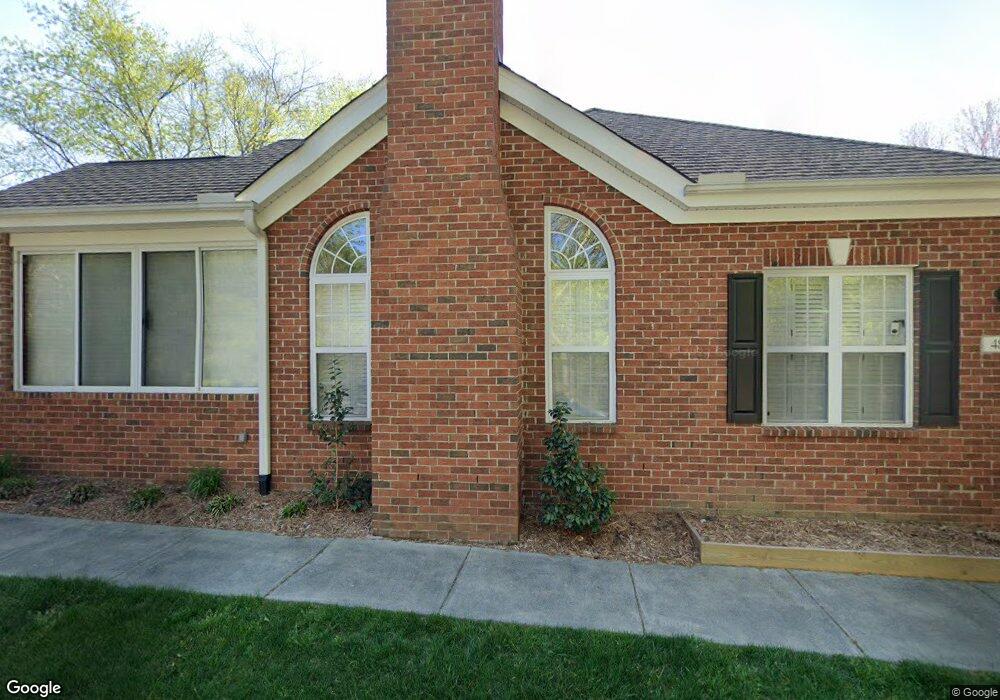
4861 Ludwell Branch Ct Raleigh, NC 27612
North Hills NeighborhoodEstimated Value: $463,000 - $538,000
2
Beds
2
Baths
1,445
Sq Ft
$347/Sq Ft
Est. Value
About This Home
This home is located at 4861 Ludwell Branch Ct, Raleigh, NC 27612 and is currently estimated at $502,000, approximately $347 per square foot. 4861 Ludwell Branch Ct is a home located in Wake County with nearby schools including Lynn Road Elementary School, Carroll Middle, and Sanderson High School.
Ownership History
Date
Name
Owned For
Owner Type
Purchase Details
Closed on
Mar 7, 2014
Sold by
Kirsch Frank N
Bought by
Guzik Jefrey and Guzik Monica Plocki
Current Estimated Value
Home Financials for this Owner
Home Financials are based on the most recent Mortgage that was taken out on this home.
Original Mortgage
$222,635
Outstanding Balance
$169,324
Interest Rate
4.43%
Mortgage Type
New Conventional
Estimated Equity
$332,676
Purchase Details
Closed on
Jan 23, 2004
Sold by
Frazelle Edward Hardy
Bought by
Kirsch Frank N and Kirsch Joann
Home Financials for this Owner
Home Financials are based on the most recent Mortgage that was taken out on this home.
Original Mortgage
$142,000
Interest Rate
5.85%
Mortgage Type
Unknown
Purchase Details
Closed on
Oct 31, 2002
Sold by
Wkb Raleigh Llc
Bought by
Frazelle Helen H
Create a Home Valuation Report for This Property
The Home Valuation Report is an in-depth analysis detailing your home's value as well as a comparison with similar homes in the area
Home Values in the Area
Average Home Value in this Area
Purchase History
| Date | Buyer | Sale Price | Title Company |
|---|---|---|---|
| Guzik Jefrey | $242,000 | None Available | |
| Kirsch Frank N | $222,000 | -- | |
| Frazelle Helen H | $217,000 | -- |
Source: Public Records
Mortgage History
| Date | Status | Borrower | Loan Amount |
|---|---|---|---|
| Open | Guzik Jefrey | $222,635 | |
| Previous Owner | Kirsch Frank N | $142,000 |
Source: Public Records
Tax History Compared to Growth
Tax History
| Year | Tax Paid | Tax Assessment Tax Assessment Total Assessment is a certain percentage of the fair market value that is determined by local assessors to be the total taxable value of land and additions on the property. | Land | Improvement |
|---|---|---|---|---|
| 2025 | $4,277 | $488,127 | $150,000 | $338,127 |
| 2024 | $4,259 | $488,127 | $150,000 | $338,127 |
| 2023 | $3,407 | $310,773 | $65,000 | $245,773 |
| 2022 | $3,167 | $310,773 | $65,000 | $245,773 |
| 2021 | $3,044 | $310,773 | $65,000 | $245,773 |
| 2020 | $2,989 | $310,773 | $65,000 | $245,773 |
| 2019 | $2,795 | $239,481 | $45,000 | $194,481 |
| 2018 | $2,637 | $239,481 | $45,000 | $194,481 |
| 2017 | $2,511 | $239,481 | $45,000 | $194,481 |
| 2016 | $2,460 | $239,481 | $45,000 | $194,481 |
| 2015 | $2,552 | $244,542 | $60,000 | $184,542 |
| 2014 | $1,979 | $244,542 | $60,000 | $184,542 |
Source: Public Records
Map
Nearby Homes
- 4742 Ludwell Branch Ct
- 4724 Ludwell Branch Ct
- 5301 Thayer Dr
- 4622 Ludwell Branch Ct
- 5013 Coronado Dr
- 1904 French Dr
- 4830 N Hills Dr
- 5500 N Hills Dr
- 1212 Gunnison Place
- 1116 Kimberly Dr
- 4508 Leaf Ct
- 5309 Ridgeloch Place
- 822 Northbrook Dr
- 1500 Shadowood Ln
- 1920 Hillock Dr
- 802 Tyrrell Rd
- 806 Tyrrell Rd
- 5444 Pine Top Cir
- 1500 Prisma Ct
- 5418 Ridgeloch Place
- 4863 Ludwell Branch Ct
- 4701 Swanley Ct
- 4702 Swanley Ct
- 4846 Ludwell Branch Ct
- 4700 Swanley Ct
- 4844 Ludwell Branch Ct
- 4803 Newham Ct
- 4823 Ludwell Branch Ct
- 4842 Ludwell Branch Ct
- 4821 Ludwell Branch Ct
- 4840 Ludwell Branch Ct
- 4805 Ludwell Branch Ct
- 4801 Newham Ct
- 4838 Ludwell Branch Ct
- 4800 Mcchesney Ct
- 4803 Mcchesney Ct
- 4803 Ludwell Branch Ct
- 4824 Ludwell Branch Ct
- 4822 Ludwell Branch Ct
- 4820 Ludwell Branch Ct