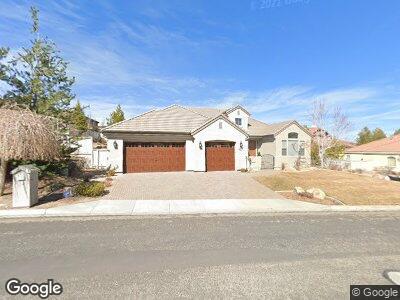
4865 Aberfeldy Rd Unit 6 Reno, NV 89519
South Outer Reno NeighborhoodEstimated Value: $1,128,329 - $1,255,000
3
Beds
3
Baths
2,934
Sq Ft
$404/Sq Ft
Est. Value
About This Home
This home is located at 4865 Aberfeldy Rd Unit 6, Reno, NV 89519 and is currently estimated at $1,184,332, approximately $403 per square foot. 4865 Aberfeldy Rd Unit 6 is a home located in Washoe County with nearby schools including Caughlin Ranch Elementary School, Darrell C Swope Middle School, and Reno High School.
Ownership History
Date
Name
Owned For
Owner Type
Purchase Details
Closed on
Oct 22, 2003
Sold by
Newman James and Newman Teri L
Bought by
Newman James and Newman Teri L
Current Estimated Value
Home Financials for this Owner
Home Financials are based on the most recent Mortgage that was taken out on this home.
Original Mortgage
$100,000
Interest Rate
5.94%
Mortgage Type
Credit Line Revolving
Purchase Details
Closed on
Oct 6, 2003
Sold by
Homecrafters Ltd
Bought by
Newman James and Newman Teri L
Home Financials for this Owner
Home Financials are based on the most recent Mortgage that was taken out on this home.
Original Mortgage
$100,000
Interest Rate
5.94%
Mortgage Type
Credit Line Revolving
Purchase Details
Closed on
Mar 24, 2003
Sold by
Stitser Robert D
Bought by
Creekside Llc
Purchase Details
Closed on
Mar 14, 2003
Sold by
Western Exchange Services Corp
Bought by
Stitser Robert D
Create a Home Valuation Report for This Property
The Home Valuation Report is an in-depth analysis detailing your home's value as well as a comparison with similar homes in the area
Home Values in the Area
Average Home Value in this Area
Purchase History
| Date | Buyer | Sale Price | Title Company |
|---|---|---|---|
| Newman James | -- | -- | |
| Newman James | $1,491,033 | First American Title | |
| Homecrafters Ltd | $1,491,033 | First American Title | |
| Creekside Llc | $283,610 | -- | |
| Stitser Robert D | $283,610 | -- | |
| Stitser Robert D | $283,610 | -- |
Source: Public Records
Mortgage History
| Date | Status | Borrower | Loan Amount |
|---|---|---|---|
| Open | Newman James | $190,000 | |
| Closed | Newman James | $228,000 | |
| Closed | Newman James | $100,000 | |
| Closed | Newman James | $322,700 |
Source: Public Records
Tax History Compared to Growth
Tax History
| Year | Tax Paid | Tax Assessment Tax Assessment Total Assessment is a certain percentage of the fair market value that is determined by local assessors to be the total taxable value of land and additions on the property. | Land | Improvement |
|---|---|---|---|---|
| 2025 | $6,100 | $262,910 | $81,200 | $181,710 |
| 2024 | $6,100 | $263,767 | $81,200 | $182,567 |
| 2023 | $4,434 | $252,817 | $79,975 | $172,842 |
| 2022 | $5,748 | $206,667 | $62,615 | $144,052 |
| 2021 | $5,582 | $194,011 | $50,785 | $143,226 |
| 2020 | $5,418 | $191,270 | $47,810 | $143,460 |
| 2019 | $5,260 | $181,546 | $43,015 | $138,531 |
| 2018 | $5,106 | $169,124 | $33,880 | $135,244 |
| 2017 | $4,959 | $168,921 | $33,600 | $135,321 |
| 2016 | $4,833 | $170,351 | $31,955 | $138,396 |
| 2015 | $3,620 | $153,813 | $28,630 | $125,183 |
| 2014 | $4,684 | $128,680 | $20,930 | $107,750 |
| 2013 | -- | $124,022 | $17,430 | $106,592 |
Source: Public Records
Map
Nearby Homes
- 4875 Mountainshyre Rd
- 4700 Aberfeldy Rd
- 4865 Sierra Pine Dr
- 3875 Gibraltar Dr
- 4856 Sierra Pine Ct
- 2593 Chaparral Ct
- 3601 Hemlock Way
- 2382 Silver Ridge Dr
- 4822 RaMcReek Trail
- 3755 Heavenly Valley Ln
- 4104 Copper Valley Ln Unit Ascente 17
- 3658 Hemlock Way
- 3880 Royer Ct
- 4863 Elkcreek Trail
- 3623 Skyline Blvd
- 3601 Skyline Blvd Unit 33
- 3601 Skyline Blvd Unit 3
- 3425 Skyline Blvd
- 3369 Skyline Blvd
- 3650 Salerno Dr
- 4865 Aberfeldy Rd Unit 6
- 4855 Aberfeldy Rd Unit 6
- 4390 Dundee Rd
- 4380 Dundee Rd Unit 6
- 4845 Aberfeldy Rd
- 4835 Aberfeldy Rd
- 4860 Aberfeldy Rd
- 4850 Aberfeldy Rd Unit 6
- 4370 Dundee Rd
- 4870 Aberfeldy Rd
- 4840 Aberfeldy Rd
- 4340 Dundee Rd
- 4330 Dundee Rd
- 4350 Dundee Rd
- 4825 Aberfeldy Rd
- 4360 Dundee Rd
- 4381 Dundee Rd
- 4830 Aberfeldy Rd
- 4391 Dundee Rd
- 4320 Dundee Rd