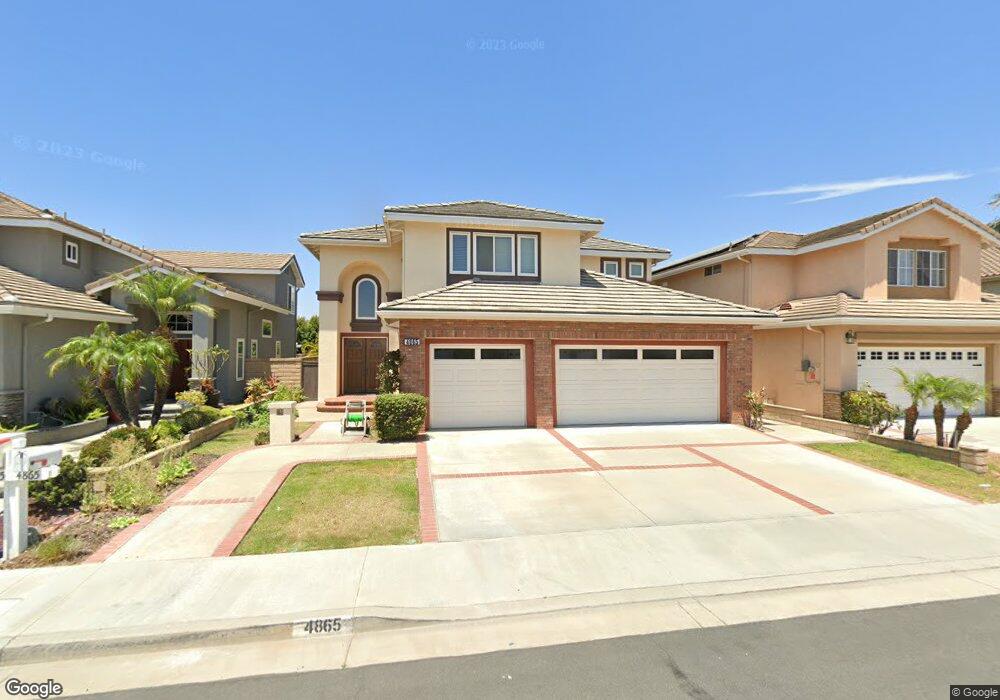
4865 Linaro Dr Cypress, CA 90630
Estimated Value: $1,456,000 - $1,780,000
5
Beds
3
Baths
2,901
Sq Ft
$555/Sq Ft
Est. Value
About This Home
This home is located at 4865 Linaro Dr, Cypress, CA 90630 and is currently estimated at $1,610,399, approximately $555 per square foot. 4865 Linaro Dr is a home located in Orange County with nearby schools including Margaret Landell Elementary School, A.E. Arnold Elementary School, and Lexington Junior High School.
Ownership History
Date
Name
Owned For
Owner Type
Purchase Details
Closed on
Mar 19, 2014
Sold by
Yeh Hen Geul and Lee Chia Ho
Bought by
Yeh & Lee Family Living Trust
Current Estimated Value
Home Financials for this Owner
Home Financials are based on the most recent Mortgage that was taken out on this home.
Original Mortgage
$258,750
Outstanding Balance
$75,840
Interest Rate
4.25%
Mortgage Type
New Conventional
Estimated Equity
$1,534,559
Purchase Details
Closed on
Dec 28, 2011
Sold by
Yeh Hen Geul and Lee Chia Ho
Bought by
Yeh Hen Geul and Lee Chiaho
Purchase Details
Closed on
Mar 29, 1995
Sold by
Cypress Homes Inc
Bought by
Yeh Hen Geul and Lee Chia Ho
Home Financials for this Owner
Home Financials are based on the most recent Mortgage that was taken out on this home.
Original Mortgage
$277,800
Interest Rate
7.61%
Create a Home Valuation Report for This Property
The Home Valuation Report is an in-depth analysis detailing your home's value as well as a comparison with similar homes in the area
Home Values in the Area
Average Home Value in this Area
Purchase History
| Date | Buyer | Sale Price | Title Company |
|---|---|---|---|
| Yeh & Lee Family Living Trust | -- | Fidelity National Title | |
| Yeh Hen Geul | -- | None Available | |
| Yeh Hen Geul | $347,500 | First American Title Ins |
Source: Public Records
Mortgage History
| Date | Status | Borrower | Loan Amount |
|---|---|---|---|
| Open | Yeh & Lee Family Living Trust | $258,750 | |
| Previous Owner | Yeh Hen Geul | $277,800 |
Source: Public Records
Tax History
| Year | Tax Paid | Tax Assessment Tax Assessment Total Assessment is a certain percentage of the fair market value that is determined by local assessors to be the total taxable value of land and additions on the property. | Land | Improvement |
|---|---|---|---|---|
| 2025 | $6,457 | $576,912 | $201,295 | $375,617 |
| 2024 | $6,457 | $565,600 | $197,348 | $368,252 |
| 2023 | $6,309 | $554,510 | $193,478 | $361,032 |
| 2022 | $6,235 | $543,638 | $189,685 | $353,953 |
| 2021 | $6,152 | $532,979 | $185,966 | $347,013 |
| 2020 | $6,128 | $527,514 | $184,059 | $343,455 |
| 2019 | $5,954 | $517,171 | $180,450 | $336,721 |
| 2018 | $5,874 | $507,031 | $176,912 | $330,119 |
| 2017 | $5,671 | $497,090 | $173,443 | $323,647 |
| 2016 | $5,622 | $487,344 | $170,043 | $317,301 |
| 2015 | $5,581 | $480,024 | $167,489 | $312,535 |
| 2014 | $6,574 | $470,621 | $164,208 | $306,413 |
Source: Public Records
Map
Nearby Homes
- 9598 Naples Dr
- 4811 Myra Ave
- 4790 Montefino Dr
- 4611 Myra Ave
- 4586 Larwin Ave
- 5258 Hanover Dr
- 10292 Ethel St
- 4449 Avenida Granada
- 5000 Clementine Ln
- 6007 Clementine Ln Unit 21
- 9011 Cerise Ln Unit 129
- 9432 Alderbury St
- 9001 Cerise Ln Unit 109
- 9001 Cerise Ln Unit 113
- 10321 Janice Lynn St
- 5353 Cumberland Dr
- 4385 Larwin Ave
- 4691 Cathy Ave
- 4305 Larwin Ave
- 4811 Newman Ave
- 4855 Linaro Dr
- 4875 Linaro Dr
- 4845 Linaro Dr
- 4885 Linaro Dr
- 4866 Tremezzo Dr
- 4876 Tremezzo Dr
- 4856 Tremezzo Dr
- 4886 Tremezzo Dr
- 4835 Linaro Dr
- 4854 Linaro Dr
- 4864 Linaro Dr
- 4895 Linaro Dr
- 4846 Tremezzo Dr
- 4844 Linaro Dr
- 4896 Tremezzo Dr
- 4874 Linaro Dr
- 4834 Linaro Dr
- 4836 Tremezzo Dr
- 4825 Linaro Dr
- 4884 Linaro Dr
Your Personal Tour Guide
Ask me questions while you tour the home.