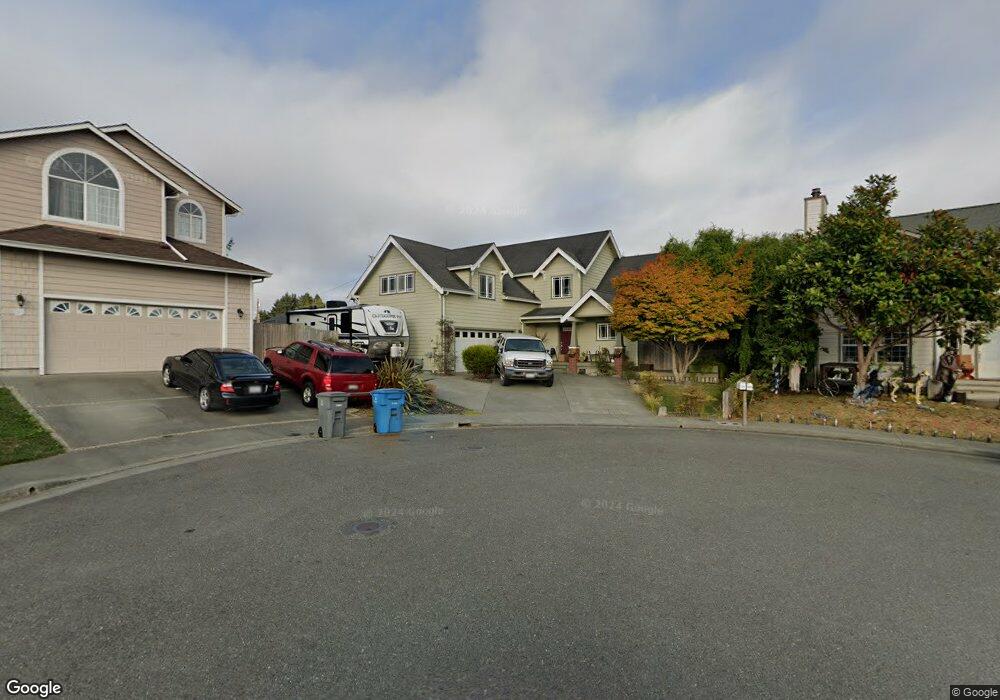
4865 Starlund Ct Eureka, CA 95503
Bayview NeighborhoodEstimated Value: $475,153 - $587,000
3
Beds
2
Baths
2,170
Sq Ft
$245/Sq Ft
Est. Value
About This Home
This home is located at 4865 Starlund Ct, Eureka, CA 95503 and is currently estimated at $531,288, approximately $244 per square foot. 4865 Starlund Ct is a home located in Humboldt County with nearby schools including Pine Hill Elementary School, South Bay Elementary School, and Pacific View Charter School.
Ownership History
Date
Name
Owned For
Owner Type
Purchase Details
Closed on
Mar 9, 2004
Sold by
Brady Bruce and Brady Vishami
Bought by
Scheffler Kevin M and Scheffler Catrina A
Current Estimated Value
Home Financials for this Owner
Home Financials are based on the most recent Mortgage that was taken out on this home.
Original Mortgage
$269,576
Interest Rate
5.38%
Mortgage Type
Purchase Money Mortgage
Create a Home Valuation Report for This Property
The Home Valuation Report is an in-depth analysis detailing your home's value as well as a comparison with similar homes in the area
Home Values in the Area
Average Home Value in this Area
Purchase History
| Date | Buyer | Sale Price | Title Company |
|---|---|---|---|
| Scheffler Kevin M | $337,000 | Humboldt Land Title Company |
Source: Public Records
Mortgage History
| Date | Status | Borrower | Loan Amount |
|---|---|---|---|
| Previous Owner | Scheffler Kevin M | $269,576 | |
| Closed | Scheffler Kevin M | $33,697 |
Source: Public Records
Tax History
| Year | Tax Paid | Tax Assessment Tax Assessment Total Assessment is a certain percentage of the fair market value that is determined by local assessors to be the total taxable value of land and additions on the property. | Land | Improvement |
|---|---|---|---|---|
| 2025 | $4,927 | $479,079 | $170,605 | $308,474 |
| 2024 | $4,927 | $469,686 | $167,260 | $302,426 |
| 2023 | $4,811 | $460,478 | $163,981 | $296,497 |
| 2022 | $5,085 | $451,450 | $160,766 | $290,684 |
| 2021 | $4,746 | $442,599 | $157,614 | $284,985 |
| 2020 | $4,615 | $438,061 | $155,998 | $282,063 |
| 2019 | $4,516 | $429,473 | $152,940 | $276,533 |
| 2018 | $4,444 | $421,053 | $149,942 | $271,111 |
| 2017 | $4,438 | $412,798 | $147,002 | $265,796 |
| 2016 | $4,435 | $404,705 | $144,120 | $260,585 |
| 2015 | $4,396 | $398,627 | $141,956 | $256,671 |
| 2014 | $4,102 | $390,820 | $139,176 | $251,644 |
Source: Public Records
Map
Nearby Homes
Your Personal Tour Guide
Ask me questions while you tour the home.