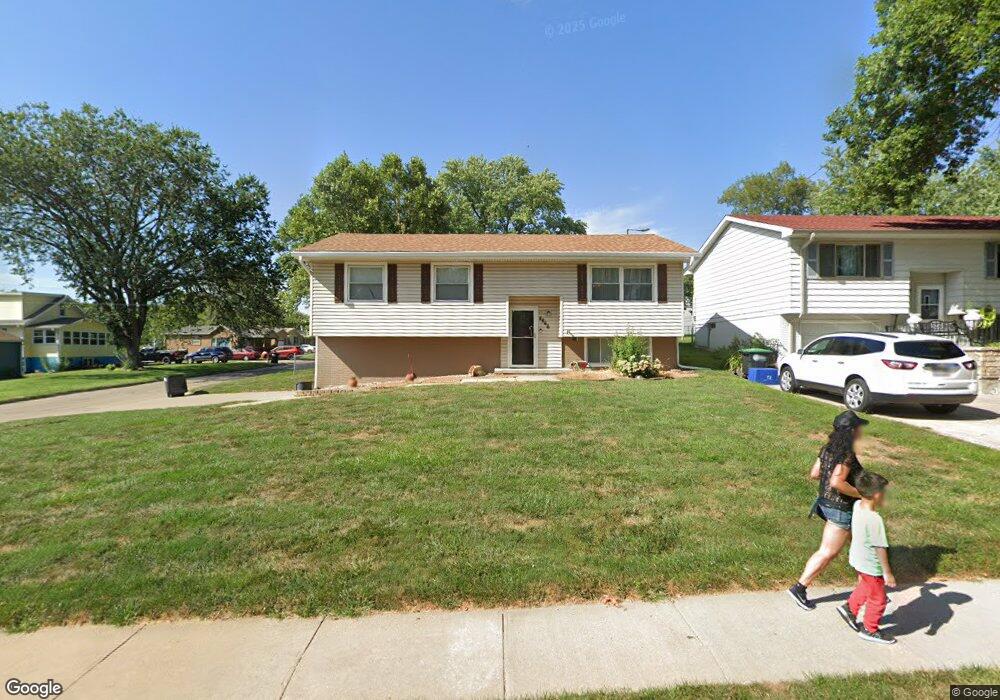
4866 O St Omaha, NE 68117
South Central Omaha NeighborhoodEstimated Value: $232,000 - $288,000
3
Beds
1
Bath
1,316
Sq Ft
$194/Sq Ft
Est. Value
About This Home
This home is located at 4866 O St, Omaha, NE 68117 and is currently estimated at $255,792, approximately $194 per square foot. 4866 O St is a home located in Douglas County with nearby schools including Ashland Park-Robbins Elementary School, St Thomas More School, and St. Peter Claver Christo Rey High School.
Ownership History
Date
Name
Owned For
Owner Type
Purchase Details
Closed on
Nov 25, 2019
Sold by
Scornavacca Renee M
Bought by
Scornavacca Renee M
Current Estimated Value
Purchase Details
Closed on
Oct 3, 2002
Sold by
Scornavacca Renee M
Bought by
Scornavacca Patricia M
Purchase Details
Closed on
Jul 30, 2002
Sold by
Scornavacca Patricia M
Bought by
Scornavacca Renee M
Home Financials for this Owner
Home Financials are based on the most recent Mortgage that was taken out on this home.
Original Mortgage
$146,000
Interest Rate
6.62%
Mortgage Type
Seller Take Back
Create a Home Valuation Report for This Property
The Home Valuation Report is an in-depth analysis detailing your home's value as well as a comparison with similar homes in the area
Home Values in the Area
Average Home Value in this Area
Purchase History
| Date | Buyer | Sale Price | Title Company |
|---|---|---|---|
| Scornavacca Renee M | -- | None Available | |
| Scornavacca Patricia M | -- | -- | |
| Scornavacca Renee M | -- | -- |
Source: Public Records
Mortgage History
| Date | Status | Borrower | Loan Amount |
|---|---|---|---|
| Previous Owner | Scornavacca Renee M | $146,000 |
Source: Public Records
Tax History
| Year | Tax Paid | Tax Assessment Tax Assessment Total Assessment is a certain percentage of the fair market value that is determined by local assessors to be the total taxable value of land and additions on the property. | Land | Improvement |
|---|---|---|---|---|
| 2025 | $3,456 | $213,700 | $14,700 | $199,000 |
| 2024 | $4,509 | $213,700 | $14,700 | $199,000 |
| 2023 | $4,509 | $213,700 | $14,700 | $199,000 |
| 2022 | $3,569 | $167,200 | $10,400 | $156,800 |
| 2021 | $3,539 | $167,200 | $10,400 | $156,800 |
| 2020 | $3,094 | $144,500 | $10,400 | $134,100 |
| 2019 | $3,088 | $143,800 | $10,400 | $133,400 |
| 2018 | $2,873 | $133,600 | $10,400 | $123,200 |
| 2017 | $2,429 | $112,400 | $7,500 | $104,900 |
| 2016 | $2,412 | $112,400 | $7,500 | $104,900 |
Source: Public Records
Map
Nearby Homes