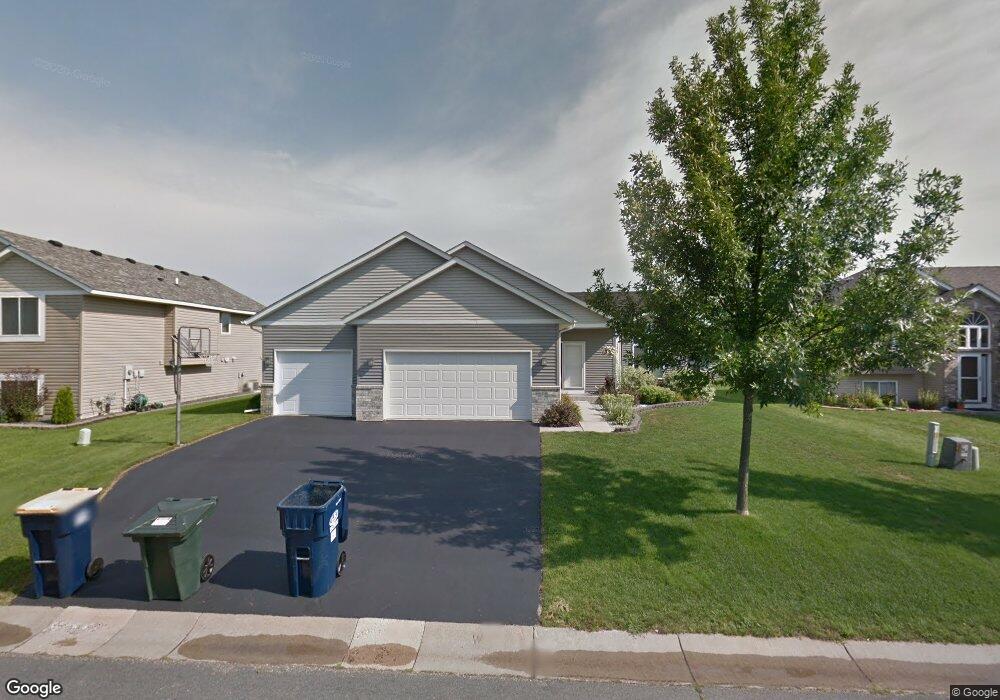
4867 190th St W Farmington, MN 55024
Estimated Value: $400,000 - $458,000
4
Beds
3
Baths
1,336
Sq Ft
$313/Sq Ft
Est. Value
About This Home
This home is located at 4867 190th St W, Farmington, MN 55024 and is currently estimated at $418,553, approximately $313 per square foot. 4867 190th St W is a home located in Dakota County with nearby schools including Akin Road Elementary School, Levi P. Dodge Middle School, and Farmington High School.
Ownership History
Date
Name
Owned For
Owner Type
Purchase Details
Closed on
Jun 3, 2016
Sold by
Rasmussen Brian J and Rasmussen Stacie G
Bought by
Stolberg Steven T
Current Estimated Value
Home Financials for this Owner
Home Financials are based on the most recent Mortgage that was taken out on this home.
Original Mortgage
$270,019
Outstanding Balance
$216,157
Interest Rate
3.75%
Mortgage Type
FHA
Estimated Equity
$202,396
Purchase Details
Closed on
Mar 9, 2010
Sold by
Brownell Theodore R and Brownell Vickie H
Bought by
Rasmussen Brian J and Rasmussen Stacie G
Purchase Details
Closed on
Apr 21, 2006
Sold by
Schomburg Todd and Schomburg Megan
Bought by
Brownell Theodore R and Brownell Vickie H
Purchase Details
Closed on
Nov 21, 2002
Sold by
Mw Johnson Construction
Bought by
Schomburg Todd
Purchase Details
Closed on
Jul 24, 2002
Sold by
The Progress Loud Co
Bought by
M W Johnson Const
Create a Home Valuation Report for This Property
The Home Valuation Report is an in-depth analysis detailing your home's value as well as a comparison with similar homes in the area
Home Values in the Area
Average Home Value in this Area
Purchase History
| Date | Buyer | Sale Price | Title Company |
|---|---|---|---|
| Stolberg Steven T | $275,000 | All American Title Company | |
| Rasmussen Brian J | $217,000 | Usrecordings Inc | |
| Brownell Theodore R | $293,900 | -- | |
| Schomburg Todd | $214,572 | -- | |
| M W Johnson Const | $1,575,000 | -- |
Source: Public Records
Mortgage History
| Date | Status | Borrower | Loan Amount |
|---|---|---|---|
| Open | Stolberg Steven T | $270,019 |
Source: Public Records
Tax History Compared to Growth
Tax History
| Year | Tax Paid | Tax Assessment Tax Assessment Total Assessment is a certain percentage of the fair market value that is determined by local assessors to be the total taxable value of land and additions on the property. | Land | Improvement |
|---|---|---|---|---|
| 2024 | $4,720 | $367,600 | $104,600 | $263,000 |
| 2023 | $4,720 | $389,400 | $104,800 | $284,600 |
| 2022 | $4,538 | $370,500 | $104,500 | $266,000 |
| 2021 | $4,348 | $324,900 | $90,900 | $234,000 |
| 2020 | $4,402 | $310,300 | $86,600 | $223,700 |
| 2019 | $4,429 | $302,200 | $82,400 | $219,800 |
| 2018 | $4,058 | $298,400 | $72,900 | $225,500 |
| 2017 | $3,958 | $268,000 | $69,400 | $198,600 |
| 2016 | $3,920 | $255,200 | $66,100 | $189,100 |
| 2015 | $3,521 | $231,336 | $59,899 | $171,437 |
| 2014 | -- | $219,128 | $55,434 | $163,694 |
| 2013 | -- | $191,987 | $48,841 | $143,146 |
Source: Public Records
Map
Nearby Homes
- 18932 Dunbury Ave
- 18973 Embry Ave
- 4750 190th St W
- 5151 193rd St W
- 19320 Ellington Trail
- 19229 Everfield Ave
- 19055 Enchanted Way
- 5412 188th St W
- 5413 186th St W
- 18840 Enhance Ct
- 19110 Euclid Path
- 18325 Embers Ave
- 4569 196th St W
- 18231 Elkwood Ave
- 4578 198th St W
- 19871 Dover Dr
- 18220 Empire Trail
- 19298 Evening Star Way
- 19741 Falcon Path
- 19697 Deerbrooke Path
- 4863 190th St W
- 4871 190th St W
- 4857 190th St W
- 4879 4879 190th-Street-w
- 4879 190th St W
- 4857 4857 190th-Street-n
- 4862 189th St W
- 4868 189th St W
- 4856 189th St W
- 4885 190th St W
- 4862 190th St W
- 4870 190th St W
- 4862 4862 190th-Street-w
- 4849 190th St W
- 4874 189th St W
- 4850 189th St W
- 4856 190th St W
- 4856 4856 190th-Street-w
- 4874 190th St W
- 4850 4850 189th-Street-w