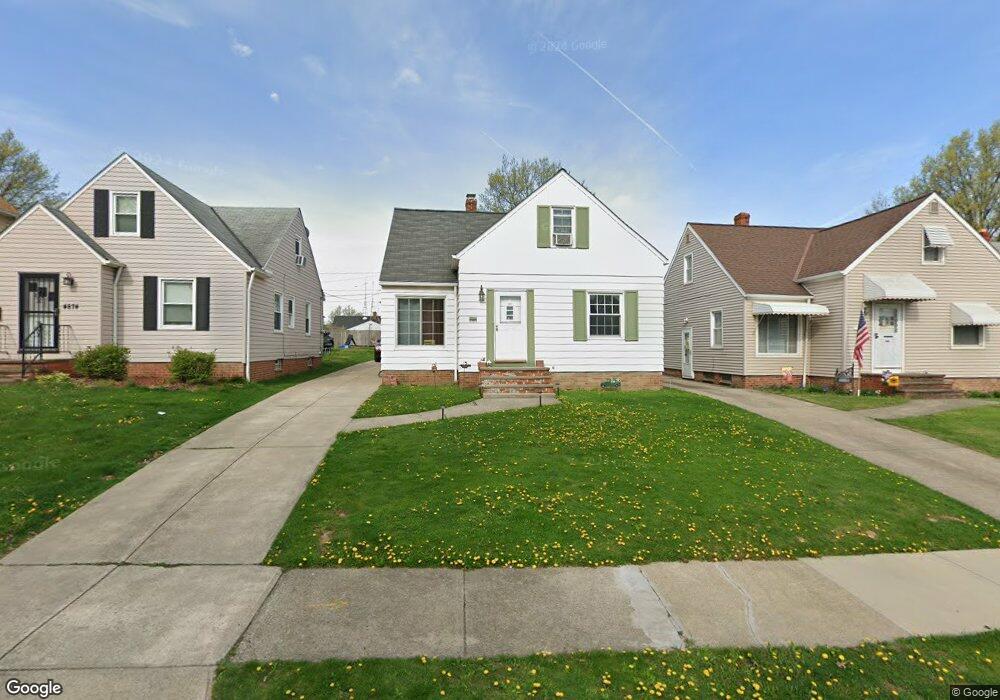
4868 E 93rd St Cleveland, OH 44125
Estimated Value: $113,000 - $137,000
3
Beds
1
Bath
1,352
Sq Ft
$89/Sq Ft
Est. Value
About This Home
This home is located at 4868 E 93rd St, Cleveland, OH 44125 and is currently estimated at $119,905, approximately $88 per square foot. 4868 E 93rd St is a home located in Cuyahoga County with nearby schools including Garfield Heights High School, North Shore High School, and Holy Name Elementary School.
Ownership History
Date
Name
Owned For
Owner Type
Purchase Details
Closed on
Nov 6, 2017
Sold by
Fechko Dorothy C
Bought by
Diaz Carrasco Henry
Current Estimated Value
Home Financials for this Owner
Home Financials are based on the most recent Mortgage that was taken out on this home.
Original Mortgage
$51,892
Outstanding Balance
$44,208
Interest Rate
4.5%
Mortgage Type
FHA
Estimated Equity
$75,697
Purchase Details
Closed on
Oct 13, 2017
Sold by
Fechko Dorothy C
Bought by
Diaz Carrasco Henry
Home Financials for this Owner
Home Financials are based on the most recent Mortgage that was taken out on this home.
Original Mortgage
$51,892
Outstanding Balance
$44,208
Interest Rate
4.5%
Mortgage Type
FHA
Estimated Equity
$75,697
Purchase Details
Closed on
Aug 3, 1979
Sold by
Fechko Richard W and D C
Bought by
Fechko Richard W
Purchase Details
Closed on
Jan 1, 1975
Bought by
Fechko Richard W and D C
Create a Home Valuation Report for This Property
The Home Valuation Report is an in-depth analysis detailing your home's value as well as a comparison with similar homes in the area
Home Values in the Area
Average Home Value in this Area
Purchase History
| Date | Buyer | Sale Price | Title Company |
|---|---|---|---|
| Diaz Carrasco Henry | $530,000 | None Available | |
| Diaz Carrasco Henry | $530,000 | None Available | |
| Fechko Richard W | -- | -- | |
| Fechko Richard W | -- | -- |
Source: Public Records
Mortgage History
| Date | Status | Borrower | Loan Amount |
|---|---|---|---|
| Open | Diaz Carrasco Henry | $51,892 | |
| Closed | Diaz Carrasco Henry | $51,892 |
Source: Public Records
Tax History
| Year | Tax Paid | Tax Assessment Tax Assessment Total Assessment is a certain percentage of the fair market value that is determined by local assessors to be the total taxable value of land and additions on the property. | Land | Improvement |
|---|---|---|---|---|
| 2024 | $3,808 | $37,100 | $8,435 | $28,665 |
| 2023 | $2,627 | $23,380 | $4,690 | $18,690 |
| 2022 | $2,587 | $23,380 | $4,690 | $18,690 |
| 2021 | $2,738 | $23,380 | $4,690 | $18,690 |
| 2020 | $2,346 | $18,690 | $3,750 | $14,950 |
| 2019 | $2,326 | $53,400 | $10,700 | $42,700 |
| 2018 | $1,792 | $18,690 | $3,750 | $14,950 |
| 2017 | $1,218 | $17,580 | $3,680 | $13,900 |
| 2016 | $1,235 | $17,580 | $3,680 | $13,900 |
| 2015 | $1,566 | $17,580 | $3,680 | $13,900 |
| 2014 | $1,566 | $21,420 | $4,480 | $16,940 |
Source: Public Records
Map
Nearby Homes
- 4845 E 90th St
- 4864 E 94th St
- 4878 E 88th St
- 4839 E 94th St
- 4963 E 88th St
- 4748 E 94th St
- 4729 E 90th St
- 4927 E 84th St
- 9516 Alexander Rd
- 4723 E 94th St
- 4904 Donovan Dr
- 9717 David Rd
- 9302 Park Heights Ave
- 9435 Dorothy Ave
- 4690 E 90th St
- 8215 Crudele Dr
- 9717 Alexander Rd
- 8304 Garfield Blvd
- 9612 Park Heights Ave
- 4658 E 88th St
Your Personal Tour Guide
Ask me questions while you tour the home.