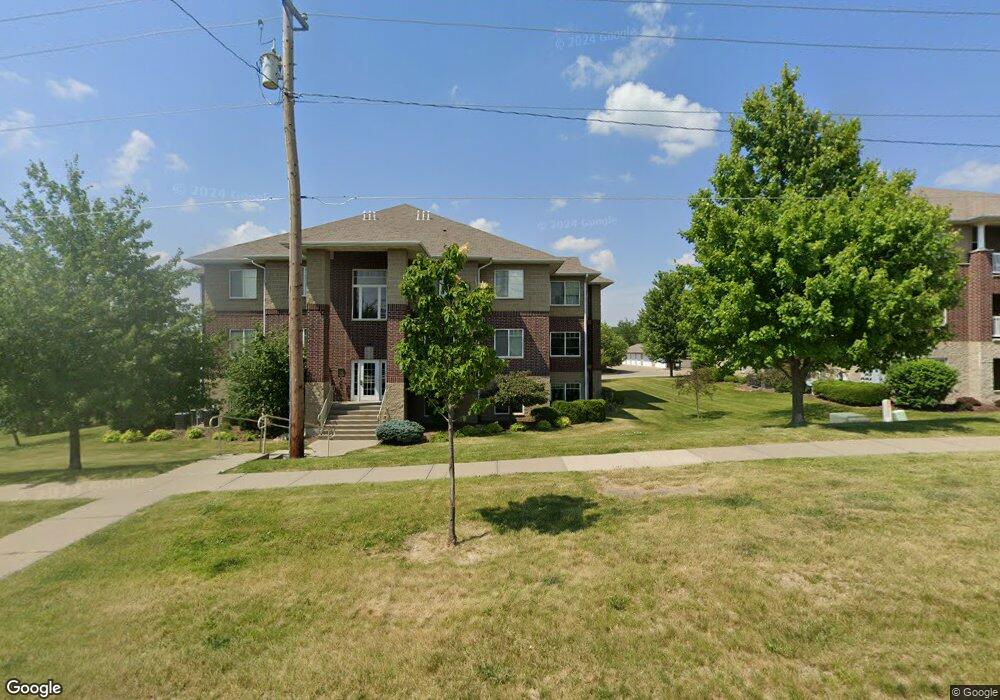
4868 E Court St Unit 40D Iowa City, IA 52245
Estimated Value: $172,000 - $185,000
2
Beds
2
Baths
1,150
Sq Ft
$157/Sq Ft
Est. Value
About This Home
This home is located at 4868 E Court St Unit 40D, Iowa City, IA 52245 and is currently estimated at $180,260, approximately $156 per square foot. 4868 E Court St Unit 40D is a home located in Johnson County with nearby schools including Helen Lemme Elementary School, Southeast Junior High School, and City High School.
Ownership History
Date
Name
Owned For
Owner Type
Purchase Details
Closed on
Sep 11, 2015
Sold by
Morris Angie Sue and Vanmetre Holly Sue
Bought by
Carlson Jonathan Carter and Carlson Susan Annette
Current Estimated Value
Home Financials for this Owner
Home Financials are based on the most recent Mortgage that was taken out on this home.
Original Mortgage
$120,600
Outstanding Balance
$92,262
Interest Rate
3.25%
Mortgage Type
Closed End Mortgage
Estimated Equity
$87,999
Purchase Details
Closed on
Jun 29, 2011
Sold by
Martini Nicholas F and Martini Sarina M
Bought by
Morris Angie Sue and Morris Holly Sue
Home Financials for this Owner
Home Financials are based on the most recent Mortgage that was taken out on this home.
Original Mortgage
$102,170
Interest Rate
4%
Mortgage Type
Adjustable Rate Mortgage/ARM
Purchase Details
Closed on
Jun 29, 2007
Sold by
Arlington Development Inc
Bought by
Martini Nicholas F and Martini Sarina M
Home Financials for this Owner
Home Financials are based on the most recent Mortgage that was taken out on this home.
Original Mortgage
$119,500
Interest Rate
6.26%
Mortgage Type
Purchase Money Mortgage
Create a Home Valuation Report for This Property
The Home Valuation Report is an in-depth analysis detailing your home's value as well as a comparison with similar homes in the area
Home Values in the Area
Average Home Value in this Area
Purchase History
| Date | Buyer | Sale Price | Title Company |
|---|---|---|---|
| Carlson Jonathan Carter | $134,000 | None Available | |
| Morris Angie Sue | $120,500 | None Available | |
| Martini Nicholas F | $127,000 | None Available |
Source: Public Records
Mortgage History
| Date | Status | Borrower | Loan Amount |
|---|---|---|---|
| Open | Carlson Jonathan Carter | $120,600 | |
| Previous Owner | Morris Angie Sue | $102,170 | |
| Previous Owner | Martini Nicholas F | $119,500 |
Source: Public Records
Tax History Compared to Growth
Tax History
| Year | Tax Paid | Tax Assessment Tax Assessment Total Assessment is a certain percentage of the fair market value that is determined by local assessors to be the total taxable value of land and additions on the property. | Land | Improvement |
|---|---|---|---|---|
| 2025 | $3,076 | $171,360 | $19,740 | $151,620 |
| 2024 | $3,036 | $161,430 | $18,090 | $143,340 |
| 2023 | $3,140 | $161,430 | $18,090 | $143,340 |
| 2022 | $3,000 | $144,830 | $15,630 | $129,200 |
| 2021 | $3,060 | $144,830 | $15,630 | $129,200 |
| 2020 | $3,060 | $141,480 | $14,800 | $126,680 |
| 2019 | $2,836 | $141,480 | $14,800 | $126,680 |
| 2018 | $2,836 | $129,050 | $14,800 | $114,250 |
| 2017 | $2,630 | $129,050 | $14,800 | $114,250 |
| 2016 | $2,580 | $119,690 | $13,160 | $106,530 |
| 2015 | $2,580 | $119,690 | $13,160 | $106,530 |
| 2014 | $2,584 | $119,420 | $13,160 | $106,260 |
Source: Public Records
Map
Nearby Homes
- 4915 E Court St
- 458 Charlotte Ln
- 485 Taft Ave SE
- 315 Taft Ave Unit 72E
- 192 Huntington Dr
- 653 Huntington Dr
- 671 Barrington Rd
- 107 Huntington Dr
- 96 Huntington Dr
- 220 Camden Rd
- 237 Camden Rd
- 275 Camden Rd Unit 275
- 901 Barrington Rd
- 180 Eversull Ln
- 225 Chadwick Ln
- 235 Chadwick Ln
- 285 Ashford Place
- 219 Eversull Ln
- 4121 Ruth St
- 4349 York Place
- 4860 E Court St Unit 36D
- 4852 E Court St Unit 32D
- 4848 E Court St
- 4856 E Court St
- 4864 E Court St
- 4858 E Court St Unit 35D
- 4850 E Court St
- 4846 E Court St
- 4854 E Court St
- 4862 E Court St Unit 37D
- 4914 E Court St Unit 47E
- 4922 E Court St
- 4906 E Court St
- 4902 E Court St
- 4910 E Court St
- 4918 E Court St
- 4916 E Court St
- 4924 E Court St
- 4908 E Court St
- 4904 E Court St Unit 42E