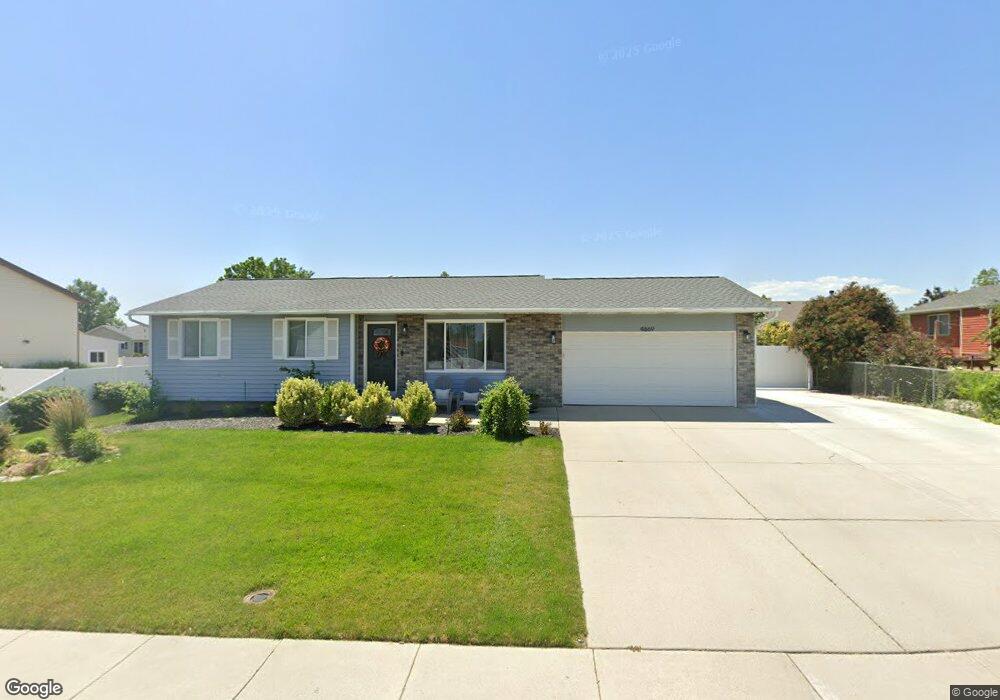
4869 W Muirkirk Rd West Jordan, UT 84081
Copper Hills NeighborhoodEstimated Value: $478,000 - $514,000
5
Beds
2
Baths
2,049
Sq Ft
$242/Sq Ft
Est. Value
About This Home
This home is located at 4869 W Muirkirk Rd, West Jordan, UT 84081 and is currently estimated at $495,685, approximately $241 per square foot. 4869 W Muirkirk Rd is a home located in Salt Lake County with nearby schools including Jordan Hills Elementary School, West Hills Middle School, and Copper Hills High School.
Ownership History
Date
Name
Owned For
Owner Type
Purchase Details
Closed on
Aug 24, 2022
Sold by
Jeff Walsh
Bought by
Mecham Bryton J and Mecham Morgan K
Current Estimated Value
Home Financials for this Owner
Home Financials are based on the most recent Mortgage that was taken out on this home.
Original Mortgage
$451,250
Outstanding Balance
$431,418
Interest Rate
5.51%
Mortgage Type
New Conventional
Estimated Equity
$64,267
Purchase Details
Closed on
Aug 10, 2022
Sold by
Krause Jenny L
Bought by
Walsh Jeff
Home Financials for this Owner
Home Financials are based on the most recent Mortgage that was taken out on this home.
Original Mortgage
$451,250
Outstanding Balance
$431,418
Interest Rate
5.51%
Mortgage Type
New Conventional
Estimated Equity
$64,267
Purchase Details
Closed on
Sep 26, 2012
Sold by
Merkley Matthew A and Merkley Cynthia J
Bought by
Krause Jenny L
Home Financials for this Owner
Home Financials are based on the most recent Mortgage that was taken out on this home.
Original Mortgage
$105,000
Interest Rate
3.59%
Mortgage Type
New Conventional
Create a Home Valuation Report for This Property
The Home Valuation Report is an in-depth analysis detailing your home's value as well as a comparison with similar homes in the area
Home Values in the Area
Average Home Value in this Area
Purchase History
| Date | Buyer | Sale Price | Title Company |
|---|---|---|---|
| Mecham Bryton J | -- | Us Title | |
| Walsh Jeff | -- | Us Title | |
| Krause Jenny L | -- | Metro National Title |
Source: Public Records
Mortgage History
| Date | Status | Borrower | Loan Amount |
|---|---|---|---|
| Open | Mecham Bryton J | $451,250 | |
| Previous Owner | Krause Jenny L | $105,000 |
Source: Public Records
Tax History Compared to Growth
Tax History
| Year | Tax Paid | Tax Assessment Tax Assessment Total Assessment is a certain percentage of the fair market value that is determined by local assessors to be the total taxable value of land and additions on the property. | Land | Improvement |
|---|---|---|---|---|
| 2025 | $2,421 | $489,300 | $143,400 | $345,900 |
| 2024 | $2,421 | $465,800 | $136,600 | $329,200 |
| 2023 | $2,463 | $446,600 | $132,600 | $314,000 |
| 2022 | $2,427 | $432,900 | $130,000 | $302,900 |
| 2021 | $2,056 | $333,900 | $105,000 | $228,900 |
| 2020 | $1,978 | $301,400 | $89,000 | $212,400 |
| 2019 | $1,962 | $293,200 | $89,000 | $204,200 |
| 2018 | $1,858 | $275,400 | $86,000 | $189,400 |
| 2017 | $1,567 | $231,200 | $86,000 | $145,200 |
| 2016 | $1,525 | $211,500 | $86,000 | $125,500 |
| 2015 | $1,527 | $206,400 | $87,600 | $118,800 |
| 2014 | $1,536 | $204,400 | $87,600 | $116,800 |
Source: Public Records
Map
Nearby Homes
- 4887 W 8620 S
- 8577 Autumn Gold Cir
- 7903 Mckenzie Ln
- 7886 Mckenzie Ln
- 8322 Copper Vista Cir
- 8359 Etude Dr
- 4624 Pine Crossing Dr
- 8441 S Spratling Dr
- 5098 Cherry Laurel Ln
- 8453 S Windmill Dr
- 8854 Rocky Creek Dr
- 8941 S Sun Leaf Dr
- 4678 Emmons Dr
- 7973 S Nebo Dr
- 4904 Wild Acres Dr
- 9118 S Wisteria Way
- 8767 S Brown Park Dr
- 9182 Wisteria Way
- 4707 W Granada Hills Ct
- 5189 W Dove Creek Ln
- 4869 Muirkirk Rd
- 8589 Mcintyre Way
- 8589 S Mcintyre Way
- 4862 W 8620 S
- 4878 W 8620 S
- 8572 Mckenzie Ln
- 8572 S Mckenzie Ln
- 4884 Muirkirk Rd
- 4846 W 8620 S
- 4839 W Muirkirk Rd
- 4839 Muirkirk Rd
- 4895 Muirkirk Rd
- 4895 W Muirkirk Rd
- 8558 Mckenzie Ln
- 8557 Mcintyre Way
- 8557 S Mcintyre Way
- 4832 W 8620 S
- 4827 Muirkirk Rd
- 8569 Mckenzie Ln
- 8569 S Mckenzie Ln