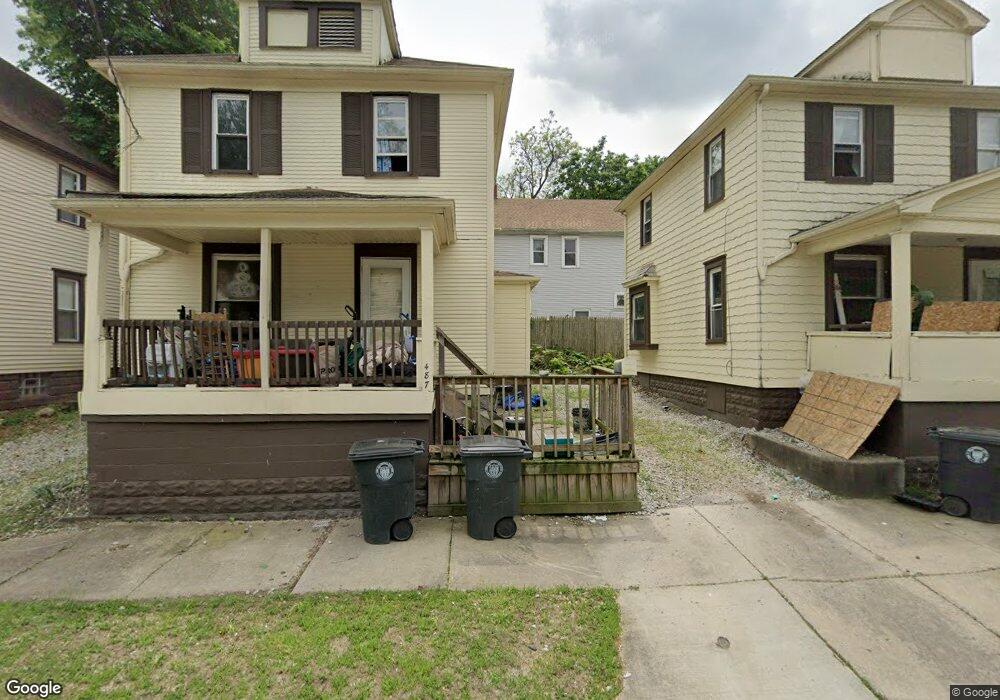
487 Bishop St Akron, OH 44307
Sherbondy Hill NeighborhoodEstimated Value: $68,066 - $127,000
5
Beds
2
Baths
1,160
Sq Ft
$75/Sq Ft
Est. Value
About This Home
This home is located at 487 Bishop St, Akron, OH 44307 and is currently estimated at $86,767, approximately $74 per square foot. 487 Bishop St is a home located in Summit County with nearby schools including Towpath Trail High School, St. Vincent Elementary School, and St Vincent-St Mary High School.
Ownership History
Date
Name
Owned For
Owner Type
Purchase Details
Closed on
Apr 1, 2020
Sold by
Mckeen Denise M and Mckeen Harry D
Bought by
Mckeen Harry D and Mckeen Denise M
Current Estimated Value
Purchase Details
Closed on
Mar 17, 2020
Sold by
Mckeen Denise M and Mckeen Harry D
Bought by
Mckeen Harry D and Mckeen Denise M
Purchase Details
Closed on
Aug 2, 1996
Sold by
D M B Enterprises
Bought by
Mckeen Harry and Mckeen Denise
Purchase Details
Closed on
Dec 15, 1994
Sold by
Mesh Effie
Bought by
Dmb Enterprises
Create a Home Valuation Report for This Property
The Home Valuation Report is an in-depth analysis detailing your home's value as well as a comparison with similar homes in the area
Home Values in the Area
Average Home Value in this Area
Purchase History
| Date | Buyer | Sale Price | Title Company |
|---|---|---|---|
| Mckeen Harry D | -- | None Listed On Document | |
| Mckeen Harry D | -- | None Listed On Document | |
| Mckeen Harry | $4,500 | -- | |
| Dmb Enterprises | $5,500 | -- |
Source: Public Records
Tax History Compared to Growth
Tax History
| Year | Tax Paid | Tax Assessment Tax Assessment Total Assessment is a certain percentage of the fair market value that is determined by local assessors to be the total taxable value of land and additions on the property. | Land | Improvement |
|---|---|---|---|---|
| 2025 | $673 | $10,276 | $2,373 | $7,903 |
| 2024 | $673 | $10,276 | $2,373 | $7,903 |
| 2023 | $673 | $10,276 | $2,373 | $7,903 |
| 2022 | $538 | $6,045 | $1,397 | $4,648 |
| 2021 | $538 | $6,045 | $1,397 | $4,648 |
| 2020 | $542 | $6,200 | $1,400 | $4,800 |
| 2019 | $815 | $9,400 | $2,130 | $7,270 |
| 2018 | $748 | $9,400 | $2,130 | $7,270 |
| 2017 | $772 | $9,400 | $2,130 | $7,270 |
| 2016 | $772 | $9,570 | $2,130 | $7,440 |
| 2015 | $772 | $9,570 | $2,130 | $7,440 |
| 2014 | $766 | $9,570 | $2,130 | $7,440 |
| 2013 | $792 | $10,150 | $2,130 | $8,020 |
Source: Public Records
Map
Nearby Homes