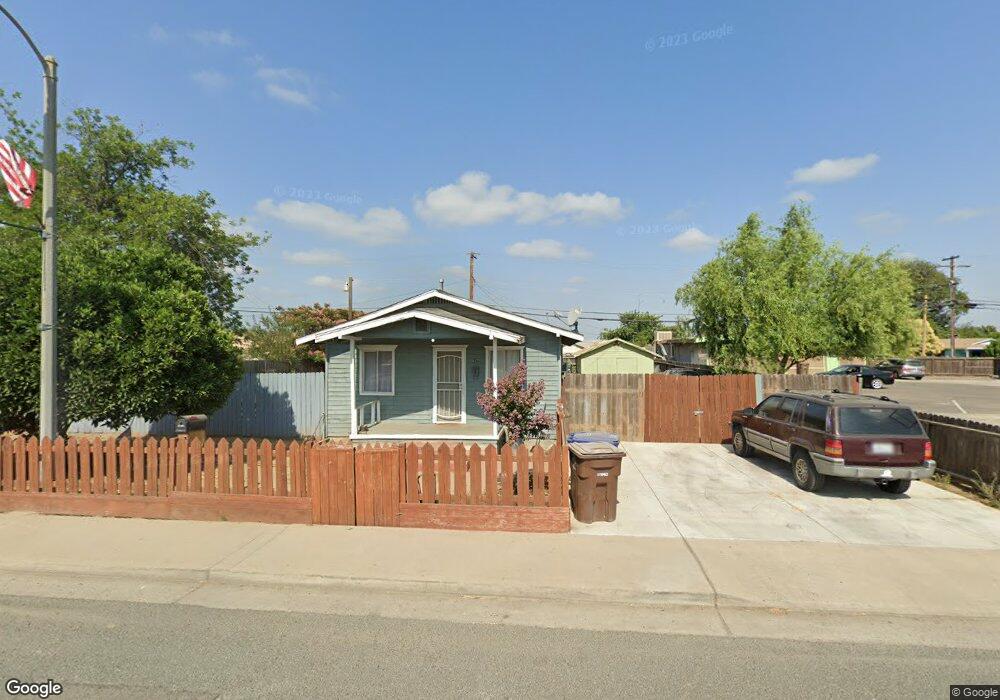
487 N Farmersville Blvd Farmersville, CA 93223
Estimated Value: $155,878 - $246,000
--
Bed
1
Bath
810
Sq Ft
$235/Sq Ft
Est. Value
About This Home
This home is located at 487 N Farmersville Blvd, Farmersville, CA 93223 and is currently estimated at $190,470, approximately $235 per square foot. 487 N Farmersville Blvd is a home located in Tulare County with nearby schools including J.E. Hester Elementary School, George L. Snowden Elementary School, and Freedom Elementary School.
Ownership History
Date
Name
Owned For
Owner Type
Purchase Details
Closed on
Jan 23, 2025
Sold by
Amezcua Edgar
Bought by
Amezcua Edgar
Current Estimated Value
Home Financials for this Owner
Home Financials are based on the most recent Mortgage that was taken out on this home.
Original Mortgage
$140,000
Outstanding Balance
$139,035
Interest Rate
6.85%
Mortgage Type
Credit Line Revolving
Estimated Equity
$51,435
Purchase Details
Closed on
Dec 3, 2020
Sold by
Cervantes Sanchez Maria G
Bought by
Amezcua Edgar
Purchase Details
Closed on
Feb 2, 1999
Sold by
Vasquez Rafael and Vasquez Octaviana
Bought by
Woods Anthony J
Home Financials for this Owner
Home Financials are based on the most recent Mortgage that was taken out on this home.
Original Mortgage
$27,206
Interest Rate
6.73%
Create a Home Valuation Report for This Property
The Home Valuation Report is an in-depth analysis detailing your home's value as well as a comparison with similar homes in the area
Home Values in the Area
Average Home Value in this Area
Purchase History
| Date | Buyer | Sale Price | Title Company |
|---|---|---|---|
| Amezcua Edgar | -- | Chicago Title | |
| Amezcua Edgar | -- | None Available | |
| Woods Anthony J | $26,000 | Chicago Title Co |
Source: Public Records
Mortgage History
| Date | Status | Borrower | Loan Amount |
|---|---|---|---|
| Open | Amezcua Edgar | $140,000 | |
| Previous Owner | Woods Anthony J | $27,206 |
Source: Public Records
Tax History Compared to Growth
Tax History
| Year | Tax Paid | Tax Assessment Tax Assessment Total Assessment is a certain percentage of the fair market value that is determined by local assessors to be the total taxable value of land and additions on the property. | Land | Improvement |
|---|---|---|---|---|
| 2025 | $424 | $37,670 | $22,601 | $15,069 |
| 2024 | $424 | $36,932 | $22,158 | $14,774 |
| 2023 | $425 | $36,209 | $21,724 | $14,485 |
| 2022 | $394 | $35,500 | $21,299 | $14,201 |
| 2021 | $386 | $34,804 | $20,881 | $13,923 |
| 2020 | $374 | $34,447 | $20,667 | $13,780 |
| 2019 | $387 | $33,772 | $20,262 | $13,510 |
| 2018 | $367 | $33,110 | $19,865 | $13,245 |
| 2017 | $380 | $32,460 | $19,475 | $12,985 |
| 2016 | $351 | $31,823 | $19,093 | $12,730 |
| 2015 | $335 | $31,345 | $18,806 | $12,539 |
| 2014 | $335 | $30,731 | $18,438 | $12,293 |
Source: Public Records
Map
Nearby Homes
- 438 N Magnolia Ave
- 701 Farmersville Rd
- 896 Farmersville Rd
- 209 S Magnolia Ave
- 0 S Farmersville Blvd Unit 238390
- 680 E Larry St
- 327 S Farmersville Blvd
- 738 E Larry St
- 188 E Citrus Dr
- 245 W Oakland St
- 322 E Citrus Dr
- 528 S Camelia Ave
- 885 E Ash St
- 903 E Ash St
- 896 N Mariposa Ave
- 732 N Dwight Ave
- 753 N Brundage Ave
- 1643 Tehama Ave
- 0 Avenue 288
- 0 Avenue 288
- 505 N Farmersville Blvd
- 463 N Farmersville Blvd
- 447 N Farmersville Blvd
- 492 N Linnell Ave
- 480 N Linnell Ave
- 504 N Linnell Ave
- 522 N Linnell Ave
- 462 N Linnell Ave
- 490 Farmersville Rd
- 172 W Elm St
- 551 N Farmersville Blvd
- 448 N Farmersville Blvd
- 514 N Farmersville Blvd
- 186 W Ash St
- 564 N Linnell Ave
- 403 N Farmersville Blvd
- 583 N Farmersville Blvd
- 432 N Farmersville Blvd
- 554 N Farmersville Blvd
- 582 N Linnell Ave