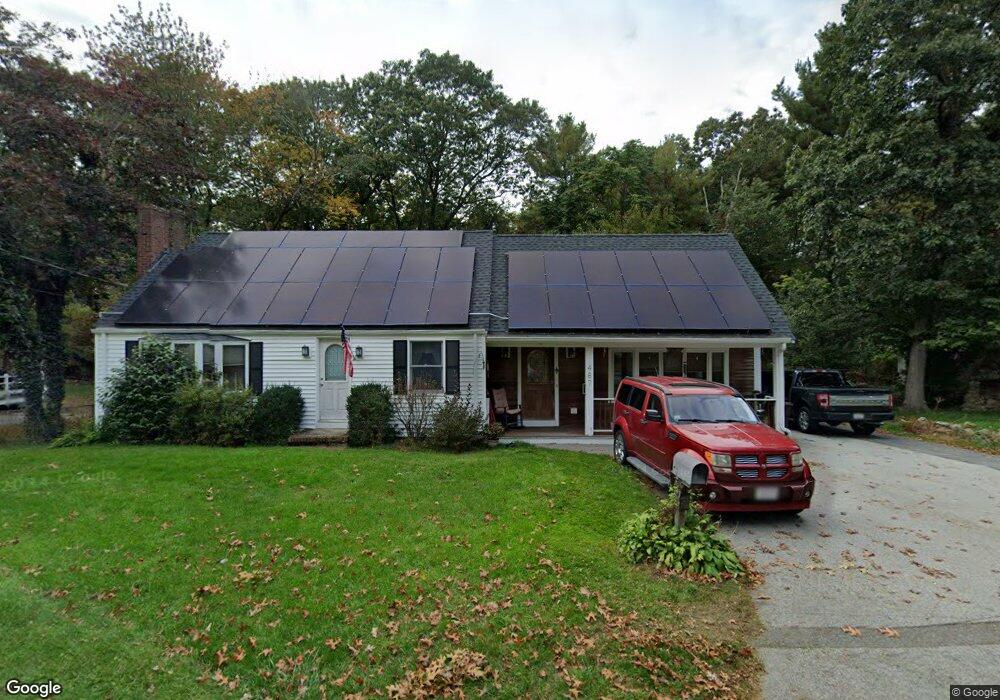
487 Thicket St South Weymouth, MA 02190
South Weymouth NeighborhoodEstimated Value: $623,000 - $812,000
3
Beds
2
Baths
2,058
Sq Ft
$345/Sq Ft
Est. Value
About This Home
This home is located at 487 Thicket St, South Weymouth, MA 02190 and is currently estimated at $711,032, approximately $345 per square foot. 487 Thicket St is a home located in Norfolk County with nearby schools including Thomas W. Hamilton Primary School, Abigail Adams Middle School, and Weymouth Middle School Chapman.
Ownership History
Date
Name
Owned For
Owner Type
Purchase Details
Closed on
Nov 16, 1994
Sold by
Ray Richard E
Bought by
Berry James E and Berry Karen J
Current Estimated Value
Home Financials for this Owner
Home Financials are based on the most recent Mortgage that was taken out on this home.
Original Mortgage
$94,000
Interest Rate
8.9%
Mortgage Type
Purchase Money Mortgage
Create a Home Valuation Report for This Property
The Home Valuation Report is an in-depth analysis detailing your home's value as well as a comparison with similar homes in the area
Home Values in the Area
Average Home Value in this Area
Purchase History
| Date | Buyer | Sale Price | Title Company |
|---|---|---|---|
| Berry James E | $118,250 | -- |
Source: Public Records
Mortgage History
| Date | Status | Borrower | Loan Amount |
|---|---|---|---|
| Open | Berry James E | $150,000 | |
| Closed | Berry James E | $90,000 | |
| Closed | Berry James E | $94,000 |
Source: Public Records
Tax History Compared to Growth
Tax History
| Year | Tax Paid | Tax Assessment Tax Assessment Total Assessment is a certain percentage of the fair market value that is determined by local assessors to be the total taxable value of land and additions on the property. | Land | Improvement |
|---|---|---|---|---|
| 2025 | $5,755 | $569,800 | $220,000 | $349,800 |
| 2024 | $5,636 | $548,800 | $209,600 | $339,200 |
| 2023 | $5,313 | $508,400 | $194,100 | $314,300 |
| 2022 | $5,227 | $456,100 | $179,700 | $276,400 |
| 2021 | $5,126 | $436,600 | $179,700 | $256,900 |
| 2020 | $4,917 | $412,500 | $179,700 | $232,800 |
| 2019 | $4,796 | $395,700 | $172,800 | $222,900 |
| 2018 | $4,724 | $377,900 | $164,500 | $213,400 |
| 2017 | $4,612 | $360,000 | $156,700 | $203,300 |
| 2016 | $4,433 | $346,300 | $150,700 | $195,600 |
| 2015 | $4,047 | $313,700 | $135,600 | $178,100 |
| 2014 | $4,005 | $301,100 | $140,300 | $160,800 |
Source: Public Records
Map
Nearby Homes
- 14 Jamieson St
- 44 Old Forge Rd
- 250 Thicket St
- 57 Sheri Ln
- 14 Kingswood Dr Unit 3
- 840 Hancock St
- 337 Randolph St
- 1085 Bedford St
- 1077 Bedford St
- 451 Lincoln St
- 169 Pond St
- 45-R Ernest St
- 1353 Washington St
- 130 Trotter Rd Unit 1309
- 130 Trotter Rd Unit 1211
- 25 Skyhawk Cir
- 120 Glen St
- 22 Medallion Rd
- 360 Plymouth St
- 0 Bedford St