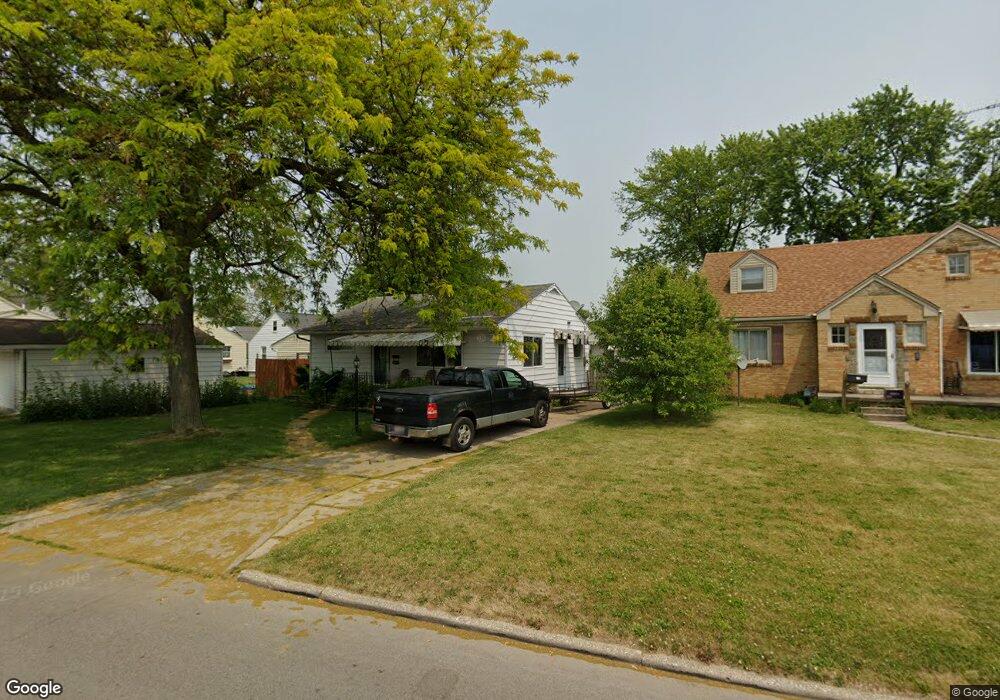
4870 292nd St Toledo, OH 43611
Point Place NeighborhoodEstimated Value: $119,000 - $145,000
3
Beds
1
Bath
1,314
Sq Ft
$103/Sq Ft
Est. Value
About This Home
This home is located at 4870 292nd St, Toledo, OH 43611 and is currently estimated at $135,333, approximately $102 per square foot. 4870 292nd St is a home located in Lucas County with nearby schools including Ottawa River Elementary School, Woodward High School, and Imagine Environmental Science Academy.
Ownership History
Date
Name
Owned For
Owner Type
Purchase Details
Closed on
Jun 13, 2016
Sold by
Nehrig Christopher
Bought by
Rockdale Partners Llc
Current Estimated Value
Purchase Details
Closed on
Jul 31, 2014
Sold by
Estate Of Carol J Nehrig
Bought by
Nehrig Christopher A and Nehrig William S
Purchase Details
Closed on
Apr 24, 2014
Sold by
Nehrig William S
Bought by
Nehrig Christopher A
Create a Home Valuation Report for This Property
The Home Valuation Report is an in-depth analysis detailing your home's value as well as a comparison with similar homes in the area
Home Values in the Area
Average Home Value in this Area
Purchase History
| Date | Buyer | Sale Price | Title Company |
|---|---|---|---|
| Rockdale Partners Llc | $29,000 | None Available | |
| Nehrig Christopher A | -- | None Available | |
| Nehrig Christopher A | -- | None Available |
Source: Public Records
Tax History
| Year | Tax Paid | Tax Assessment Tax Assessment Total Assessment is a certain percentage of the fair market value that is determined by local assessors to be the total taxable value of land and additions on the property. | Land | Improvement |
|---|---|---|---|---|
| 2025 | -- | $25,445 | $5,845 | $19,600 |
| 2024 | $819 | $25,445 | $5,845 | $19,600 |
| 2023 | $1,525 | $22,575 | $5,180 | $17,395 |
| 2022 | $1,526 | $22,575 | $5,180 | $17,395 |
| 2021 | $1,557 | $22,575 | $5,180 | $17,395 |
| 2020 | $1,469 | $18,550 | $4,270 | $14,280 |
| 2019 | $1,425 | $18,550 | $4,270 | $14,280 |
| 2018 | $1,675 | $18,550 | $4,270 | $14,280 |
| 2017 | $1,471 | $18,200 | $5,425 | $12,775 |
| 2016 | $1,933 | $70,200 | $15,500 | $54,700 |
| 2015 | $1,916 | $70,200 | $15,500 | $54,700 |
| 2014 | $1,261 | $22,120 | $5,250 | $16,870 |
| 2013 | $841 | $22,120 | $5,250 | $16,870 |
Source: Public Records
Map
Nearby Homes
- 2750 119th St
- 2426 106th St
- 2831 118th St
- 2352 108th St
- 4532 290th St
- 4539 290th St
- 2835 121st St
- 5202 302nd St
- 5219 302nd St
- 2934 S 109th St
- 5301 303rd St
- 2718 Detwiler Dr
- 3056 121st St
- 5318 Homeland Dr
- 4745 Ottawa Trail Rd
- 5159 Grosse Point Pkwy
- 5338 305th St
- 5433 Brophy Dr
- 5314 Suder Ave
- 5526 Brophy Dr
Your Personal Tour Guide
Ask me questions while you tour the home.