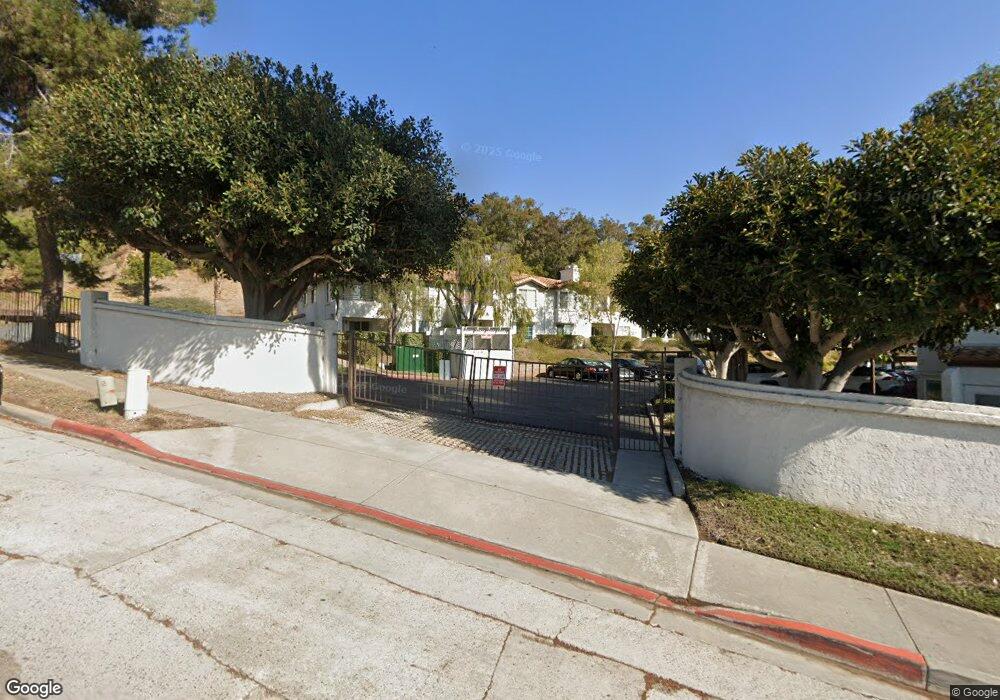
4870 Bella Pac Row Unit 156 San Diego, CA 92109
Pacific Beach NeighborhoodEstimated Value: $750,000 - $800,000
2
Beds
2
Baths
1,094
Sq Ft
$699/Sq Ft
Est. Value
About This Home
This home is located at 4870 Bella Pac Row Unit 156, San Diego, CA 92109 and is currently estimated at $764,881, approximately $699 per square foot. 4870 Bella Pac Row Unit 156 is a home located in San Diego County with nearby schools including Sessions Elementary School, Pacific Beach Middle, and Mission Bay High School.
Ownership History
Date
Name
Owned For
Owner Type
Purchase Details
Closed on
Apr 6, 2021
Sold by
Beckert Mark
Bought by
Beckert Mark and Beckert Mary
Current Estimated Value
Home Financials for this Owner
Home Financials are based on the most recent Mortgage that was taken out on this home.
Original Mortgage
$205,000
Outstanding Balance
$185,090
Interest Rate
3%
Mortgage Type
New Conventional
Estimated Equity
$579,791
Purchase Details
Closed on
May 23, 2008
Sold by
Beckert Mark and Beckert Mary
Bought by
Beckert Mark and Beckert Mary
Purchase Details
Closed on
Dec 14, 1999
Sold by
Paul
Bought by
Beckert Mark and Maidens Mary
Home Financials for this Owner
Home Financials are based on the most recent Mortgage that was taken out on this home.
Original Mortgage
$189,345
Interest Rate
7.83%
Mortgage Type
FHA
Create a Home Valuation Report for This Property
The Home Valuation Report is an in-depth analysis detailing your home's value as well as a comparison with similar homes in the area
Home Values in the Area
Average Home Value in this Area
Purchase History
| Date | Buyer | Sale Price | Title Company |
|---|---|---|---|
| Beckert Mark | -- | First American Title | |
| Beckert Mark | -- | First American Title Company | |
| Beckert Mark | -- | First American Title Company | |
| Beckert Mark | -- | Accommodation | |
| Beckert Mark | $195,000 | United Title Company |
Source: Public Records
Mortgage History
| Date | Status | Borrower | Loan Amount |
|---|---|---|---|
| Open | Beckert Mark | $205,000 | |
| Previous Owner | Beckert Mark | $189,345 |
Source: Public Records
Tax History Compared to Growth
Tax History
| Year | Tax Paid | Tax Assessment Tax Assessment Total Assessment is a certain percentage of the fair market value that is determined by local assessors to be the total taxable value of land and additions on the property. | Land | Improvement |
|---|---|---|---|---|
| 2025 | $3,638 | $299,531 | $176,740 | $122,791 |
| 2024 | $3,638 | $293,659 | $173,275 | $120,384 |
| 2023 | $3,558 | $287,902 | $169,878 | $118,024 |
| 2022 | $3,464 | $282,258 | $166,548 | $115,710 |
| 2021 | $3,440 | $276,725 | $163,283 | $113,442 |
| 2020 | $3,399 | $273,888 | $161,609 | $112,279 |
| 2019 | $3,338 | $268,519 | $158,441 | $110,078 |
| 2018 | $3,122 | $263,255 | $155,335 | $107,920 |
| 2017 | $3,048 | $258,094 | $152,290 | $105,804 |
| 2016 | $2,999 | $253,034 | $149,304 | $103,730 |
| 2015 | $2,955 | $249,234 | $147,062 | $102,172 |
| 2014 | $2,910 | $244,353 | $144,182 | $100,171 |
Source: Public Records
Map
Nearby Homes
- 2515 Geranium St
- 2522 Chalcedony St
- 2609 Pico Place Unit 127
- 2481 La Marque St
- 4647 Pico St Unit 205
- 4060 Huerfano Ave Unit 130
- 4060 Huerfano Ave Unit 125
- 4060 Huerfano Ave Unit 240
- 4060 Huerfano Ave Unit 109
- 4060 Huerfano Ave Unit 126
- 3212 Cadden Ct
- 2669 Magnolia Ave
- 4470 Bond St
- 3903 Cadden Way
- 4048 Raffee Dr
- 3341 Cadden Dr
- 4010 Paducah Dr
- 5259 Pacifica Dr
- 4135 Huerfano Ave
- 2128 Missouri St
- 4870 Bella Pacific Row Unit 154
- 4870 Bella Pacific Row Unit 155
- 4870 Bella Pacific Row Unit 253
- 4870 Bella Pac Row Unit 155
- 4870 Bella Pac Row Unit 154
- 4870 Bella Pac Row Unit 153
- 4870 Bella Pac Row Unit 256
- 4870 Bella Pac Row Unit 255
- 4870 Bella Pac Row Unit 254
- 4870 Bella Pac Row Unit 253
- 4860 Bella Pacific Row Unit 152
- 4860 Bella Pacific Row Unit 149
- 4860 Bella Pacific Row Unit 249
- 4860 Bella Pacific Row
- 4860 Bella Pacific Row Unit 252
- 4860 Bella Pac Row Unit 152
- 4860 Bella Pac Row Unit 151
- 4860 Bella Pac Row Unit 150
- 4860 Bella Pac Row Unit 149
- 4860 Bella Pac Row Unit 252