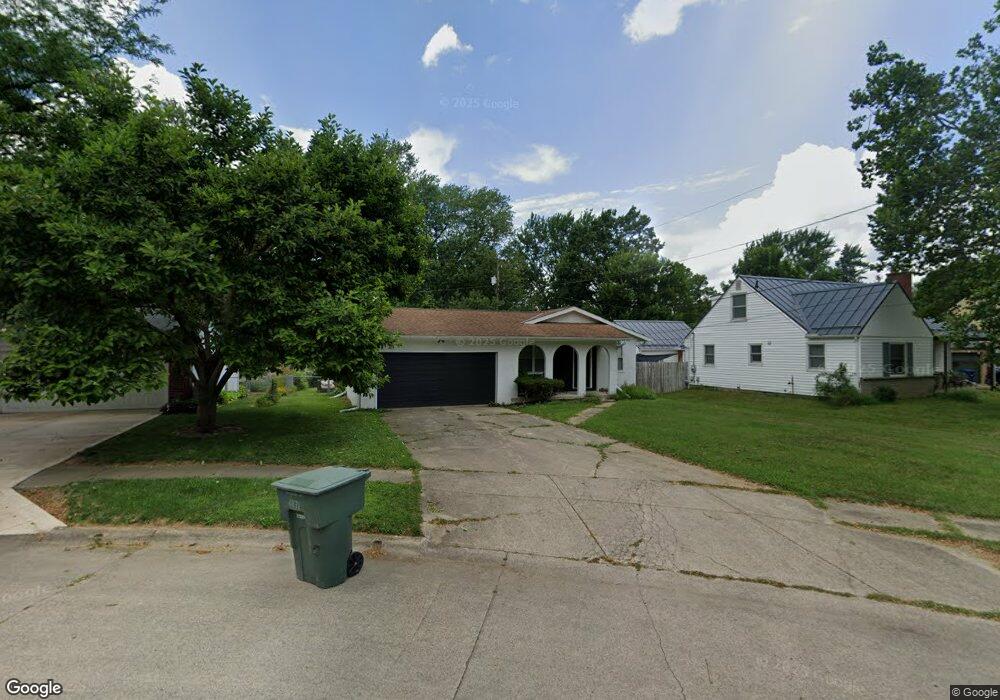
4871 Glenburn Ave Columbus, OH 43214
Clintonville NeighborhoodEstimated Value: $283,000 - $371,000
3
Beds
2
Baths
1,612
Sq Ft
$207/Sq Ft
Est. Value
About This Home
This home is located at 4871 Glenburn Ave, Columbus, OH 43214 and is currently estimated at $333,238, approximately $206 per square foot. 4871 Glenburn Ave is a home located in Franklin County with nearby schools including Colerain Elementary School, Dominion Middle School, and Whetstone High School.
Ownership History
Date
Name
Owned For
Owner Type
Purchase Details
Closed on
Oct 11, 2024
Sold by
Bh1 Llc
Bought by
Peanuts House Llc
Current Estimated Value
Purchase Details
Closed on
Feb 2, 2024
Sold by
Rjr Phoenix Const Group Llc
Bought by
Bh 1 Llc
Home Financials for this Owner
Home Financials are based on the most recent Mortgage that was taken out on this home.
Original Mortgage
$292,000
Interest Rate
6.66%
Mortgage Type
New Conventional
Purchase Details
Closed on
Jul 17, 2023
Sold by
Stein Carol Jean
Bought by
Rjr Phoenix Construction Group Llc
Home Financials for this Owner
Home Financials are based on the most recent Mortgage that was taken out on this home.
Original Mortgage
$246,600
Interest Rate
6.67%
Mortgage Type
Construction
Purchase Details
Closed on
Jan 27, 1989
Bought by
Stein Carol J
Purchase Details
Closed on
Feb 16, 1988
Create a Home Valuation Report for This Property
The Home Valuation Report is an in-depth analysis detailing your home's value as well as a comparison with similar homes in the area
Home Values in the Area
Average Home Value in this Area
Purchase History
| Date | Buyer | Sale Price | Title Company |
|---|---|---|---|
| Peanuts House Llc | -- | Axxis Title Agency | |
| Bh 1 Llc | -- | Axxis Title Agency | |
| Rjr Phoenix Construction Group Llc | $233,700 | Empora Title | |
| Stein Carol J | $71,000 | -- | |
| -- | -- | -- |
Source: Public Records
Mortgage History
| Date | Status | Borrower | Loan Amount |
|---|---|---|---|
| Previous Owner | Bh 1 Llc | $292,000 | |
| Previous Owner | Rjr Phoenix Construction Group Llc | $246,600 |
Source: Public Records
Tax History Compared to Growth
Tax History
| Year | Tax Paid | Tax Assessment Tax Assessment Total Assessment is a certain percentage of the fair market value that is determined by local assessors to be the total taxable value of land and additions on the property. | Land | Improvement |
|---|---|---|---|---|
| 2024 | $4,124 | $89,990 | $35,950 | $54,040 |
| 2023 | $3,443 | $86,880 | $35,950 | $50,930 |
| 2022 | $3,023 | $67,030 | $21,910 | $45,120 |
| 2021 | $3,028 | $67,030 | $21,910 | $45,120 |
| 2020 | $3,032 | $67,030 | $21,910 | $45,120 |
| 2019 | $2,573 | $51,170 | $16,870 | $34,300 |
| 2018 | $2,347 | $51,170 | $16,870 | $34,300 |
| 2017 | $2,572 | $51,170 | $16,870 | $34,300 |
| 2016 | $2,342 | $44,100 | $15,120 | $28,980 |
| 2015 | $2,126 | $44,100 | $15,120 | $28,980 |
| 2014 | $2,131 | $44,100 | $15,120 | $28,980 |
| 2013 | $989 | $42,000 | $14,385 | $27,615 |
Source: Public Records
Map
Nearby Homes
- 381 E Jeffrey Place
- 420 E Beechwold Blvd
- 518 E Royal Forest Blvd
- 522 E Beechwold Blvd
- 597 Morse Rd
- 601 Morse Rd
- 255 Garden Rd
- 411 Garden Rd
- 4 W Royal Forest Blvd
- 156 E Weisheimer Rd
- 116 Rathbone Ave
- 87 Charleston Ave
- 202 Rathbone Ave
- 33 Rosslyn Ave
- 4299 Colerain Ave
- 125 Sheffield Rd
- 253 Fenway Rd
- 4994 Delawanda Ave
- 292 Chase Rd
- 569 Chase Rd