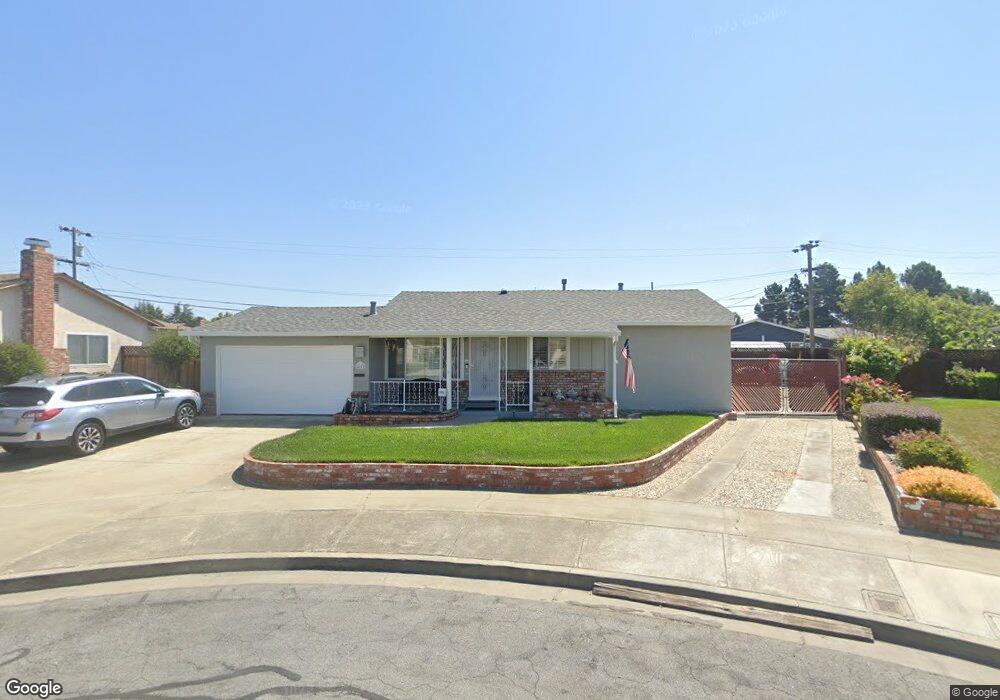
4872 Piper St Fremont, CA 94538
Sundale NeighborhoodEstimated Value: $1,366,000 - $1,496,000
3
Beds
2
Baths
1,472
Sq Ft
$970/Sq Ft
Est. Value
About This Home
This home is located at 4872 Piper St, Fremont, CA 94538 and is currently estimated at $1,427,224, approximately $969 per square foot. 4872 Piper St is a home located in Alameda County with nearby schools including John Blacow Elementary School, G.M. Walters Middle School, and John F. Kennedy High School.
Ownership History
Date
Name
Owned For
Owner Type
Purchase Details
Closed on
Jun 27, 2014
Sold by
Mapelli Johnny C and Mapelli Odette A
Bought by
Decl Johnny C Mapelli and Decl Odette A Mapelli
Current Estimated Value
Purchase Details
Closed on
Nov 10, 2009
Sold by
Mapelli Johnny Charles and Mapelli Odette Andree
Bought by
Mapelli Johnny C and Mapelli Odette A
Purchase Details
Closed on
Mar 19, 2004
Sold by
Mapelli Odette Andree
Bought by
Mapelli Odette Andree and Mapelli Johnny Charles
Create a Home Valuation Report for This Property
The Home Valuation Report is an in-depth analysis detailing your home's value as well as a comparison with similar homes in the area
Home Values in the Area
Average Home Value in this Area
Purchase History
| Date | Buyer | Sale Price | Title Company |
|---|---|---|---|
| Decl Johnny C Mapelli | -- | None Available | |
| Mapelli Johnny C | -- | None Available | |
| Mapelli Odette Andree | -- | None Available | |
| Mapelli Odette Andree | -- | -- |
Source: Public Records
Tax History
| Year | Tax Paid | Tax Assessment Tax Assessment Total Assessment is a certain percentage of the fair market value that is determined by local assessors to be the total taxable value of land and additions on the property. | Land | Improvement |
|---|---|---|---|---|
| 2025 | $1,650 | $74,273 | $24,203 | $57,070 |
| 2024 | $1,650 | $72,679 | $23,728 | $55,951 |
| 2023 | $1,585 | $78,117 | $23,263 | $54,854 |
| 2022 | $1,534 | $69,585 | $22,807 | $53,778 |
| 2021 | $1,503 | $68,084 | $22,360 | $52,724 |
| 2020 | $1,411 | $74,315 | $22,131 | $52,184 |
| 2019 | $1,399 | $72,858 | $21,697 | $51,161 |
| 2018 | $1,367 | $71,428 | $21,271 | $50,157 |
| 2017 | $1,332 | $70,028 | $20,854 | $49,174 |
| 2016 | $1,294 | $68,655 | $20,445 | $48,210 |
| 2015 | $1,261 | $67,624 | $20,138 | $47,486 |
| 2014 | $1,228 | $66,300 | $19,744 | $46,556 |
Source: Public Records
Map
Nearby Homes
- 5084 Hilo St
- 5441 Crimson Cir
- 4784 Wheeler Dr
- 40772 Blacow Rd
- 40242 Crockett St
- 40335 Robin St
- 4531 Stevenson Blvd
- 5641 Chestnut Common
- 4514 Wheeler Dr
- 4475 Millard Ave
- 5560 Cosmos Common Unit 125
- 4612 Drury Ct
- 39627 Sundale Dr
- 39620 Bliss Ct
- 4498 Ladner St
- 5751 Birch Terrace
- 39666 Whitecap Way
- 4412 Millard Ave
- 4600 Nelson St
- 39605 Bruning St
Your Personal Tour Guide
Ask me questions while you tour the home.